Infrastructure
Critical infrastructure monitoring and water leak warnings for infrastructure networks.
Infrastructure underlies modern civilization and includes:
- Drinking and irrigation water
- Sewage
- Electricity
- Oil and gas pipelines
- Roads and highways
- Airports and seaports
- Wired and wireless communication
- Railways
- Dams and canals
EarthToDate provides Critical Infrastructure Monitoring, as well as agriculture-specific indexes and analytics.
Additionally, EarthToDate provides other infrastructure-specific analytics.
Critical Infrastructure Monitoring Coming soon
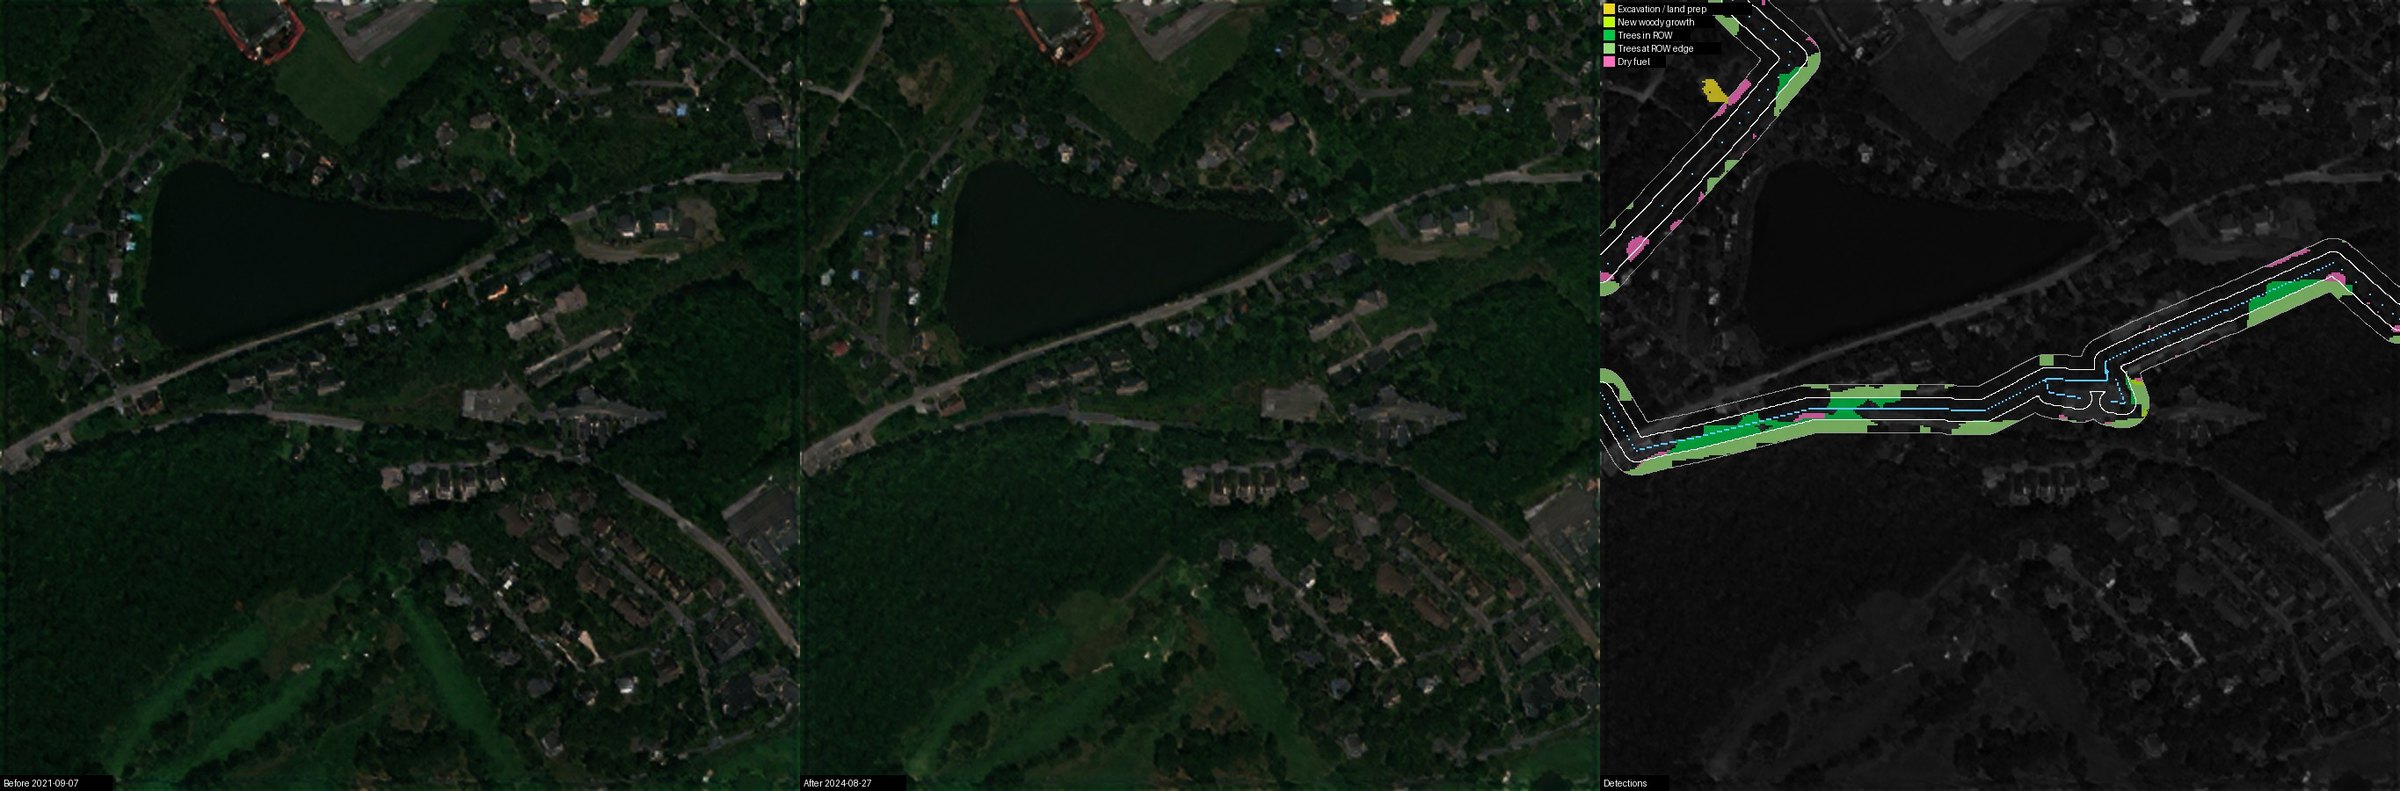
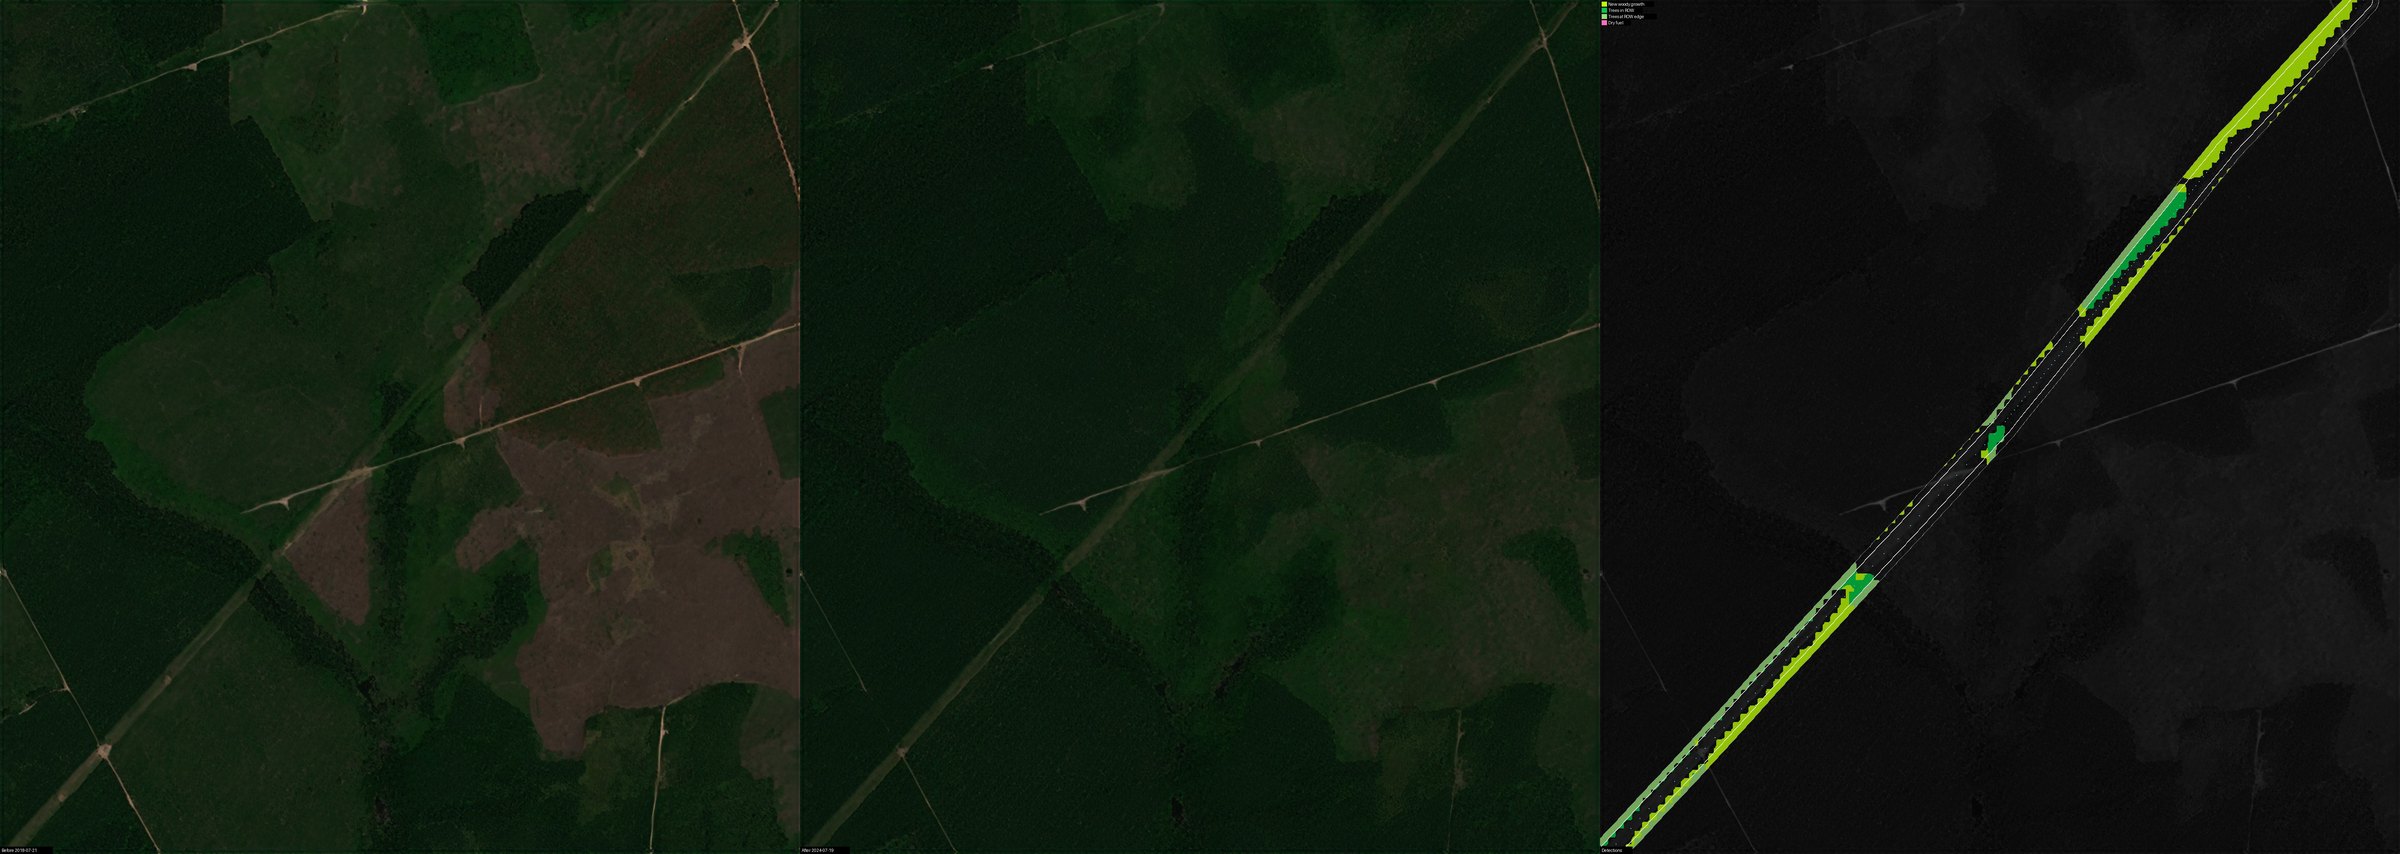
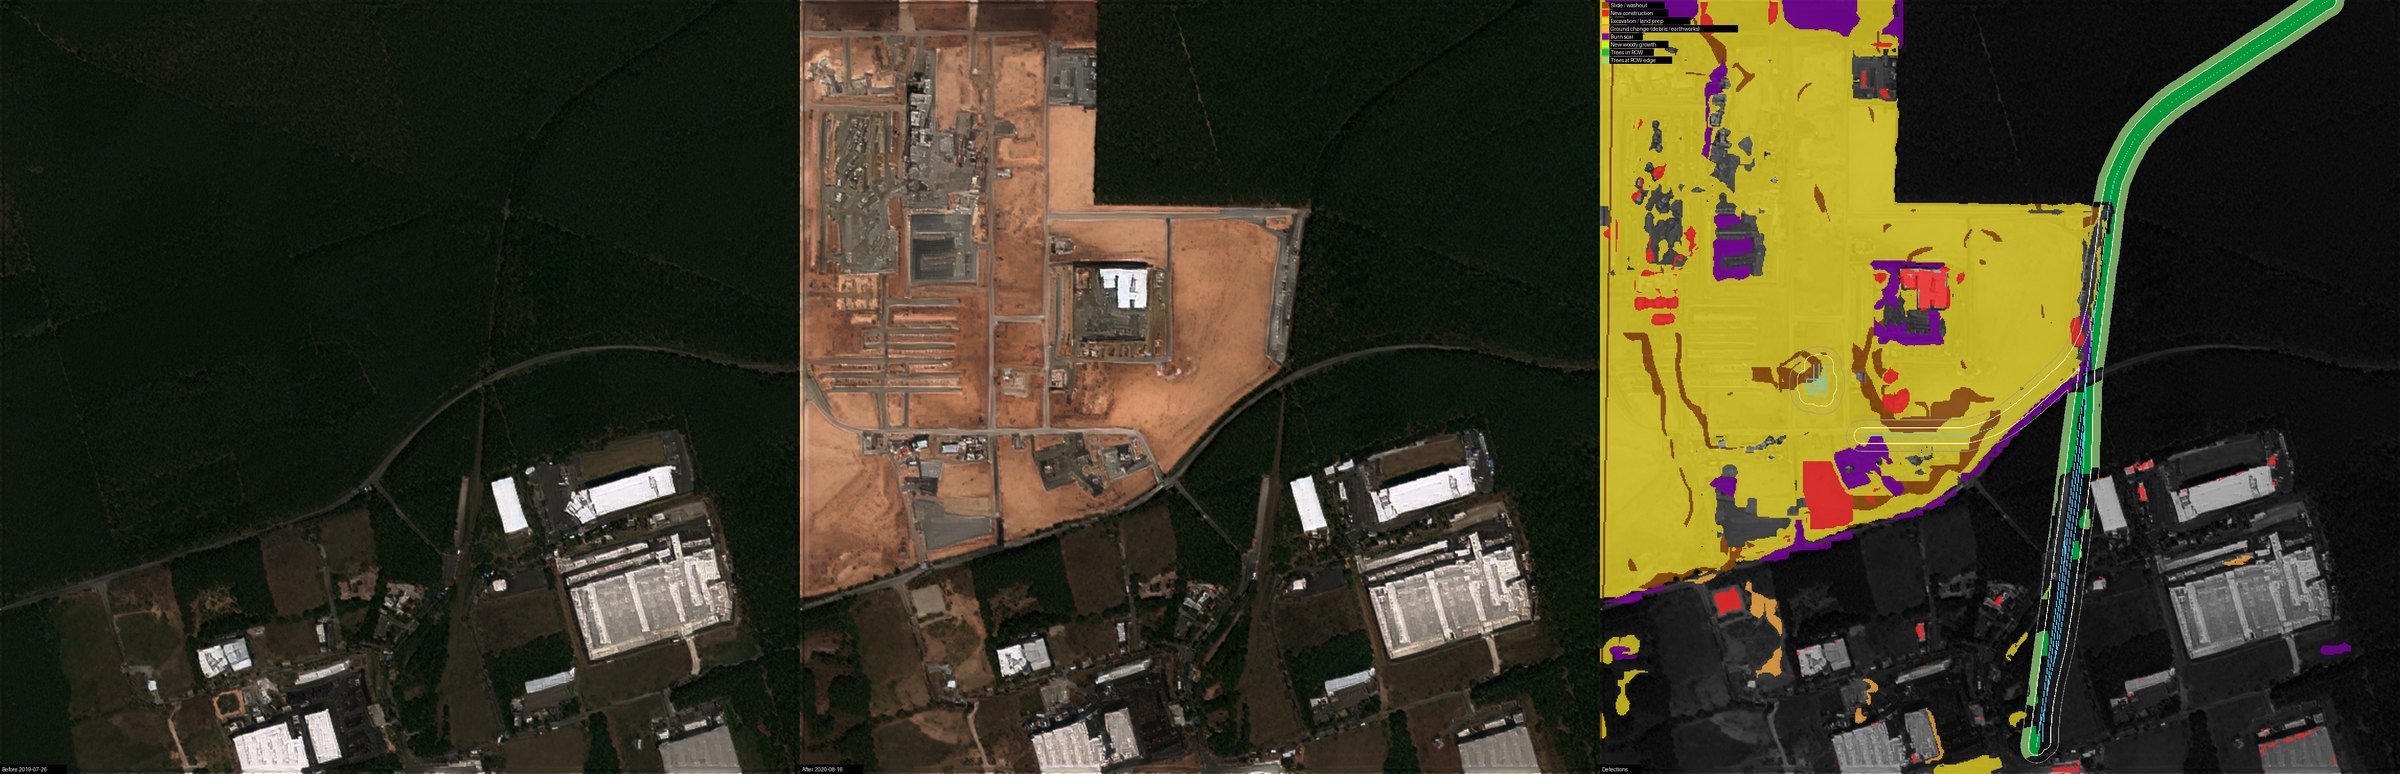
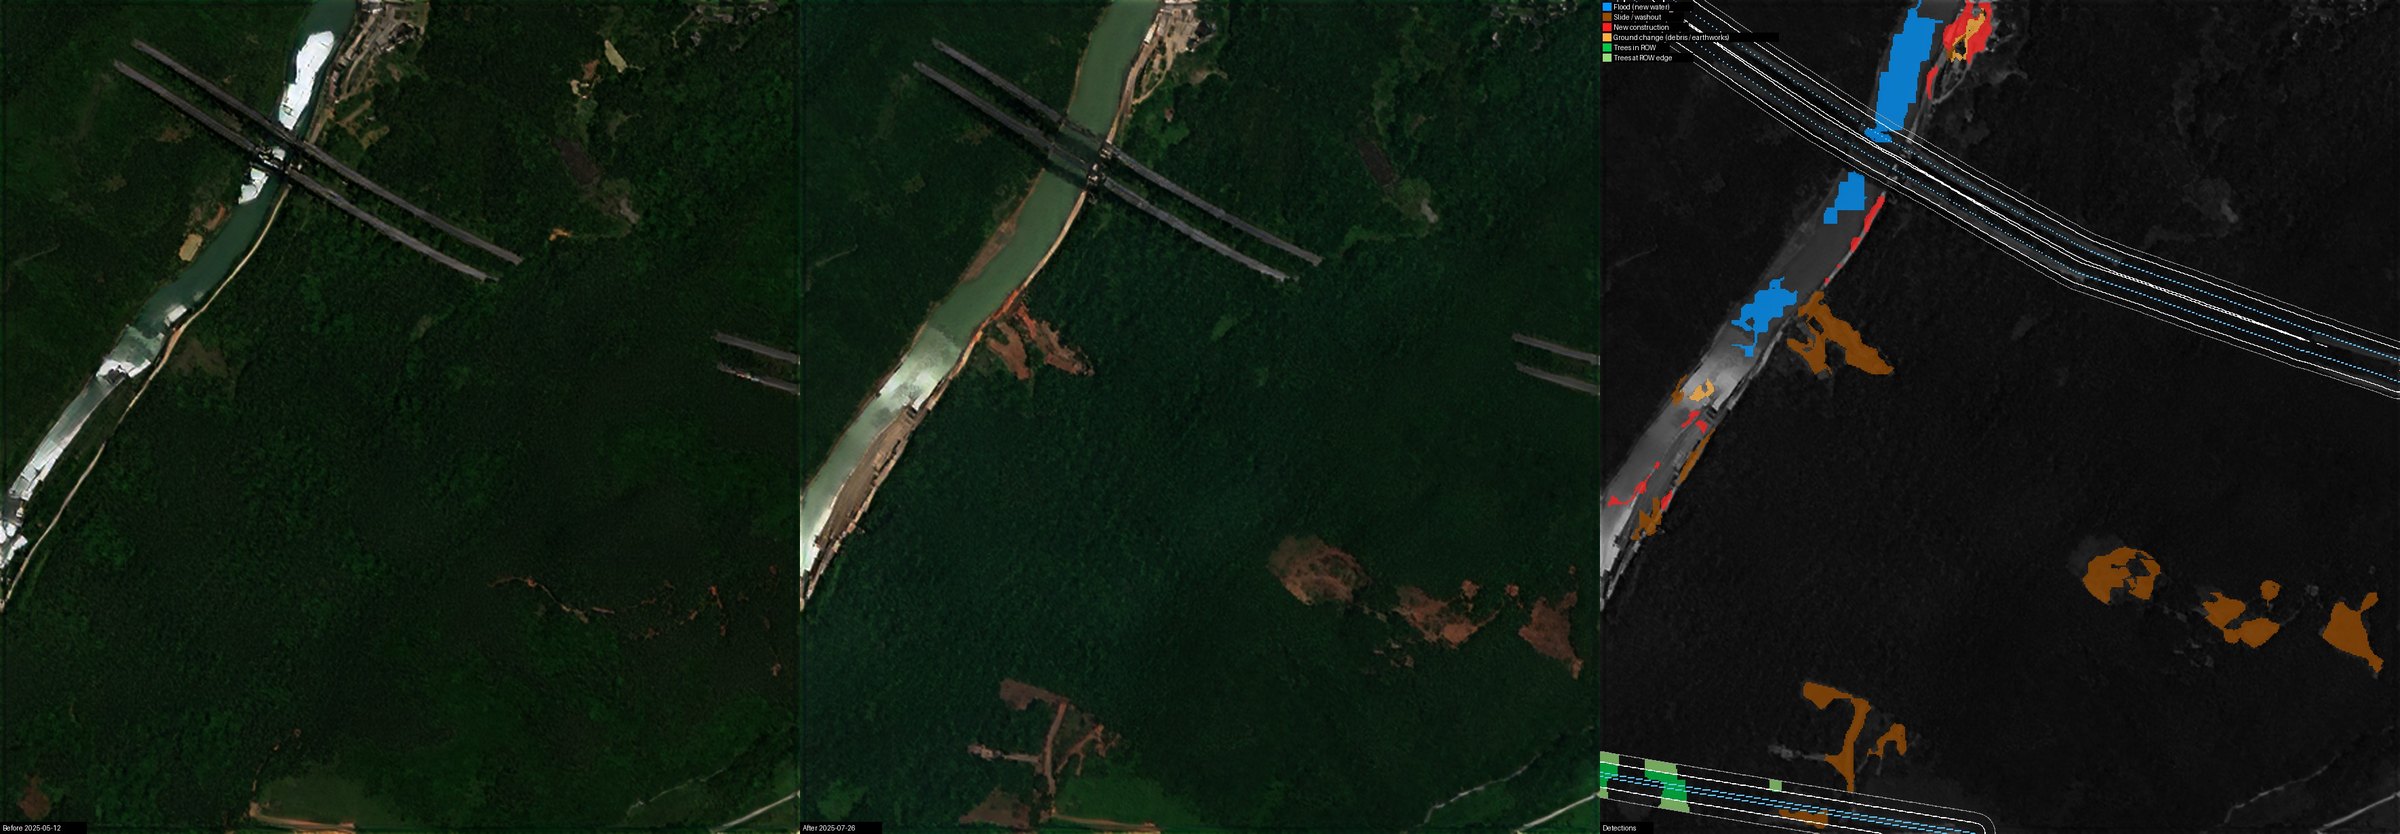
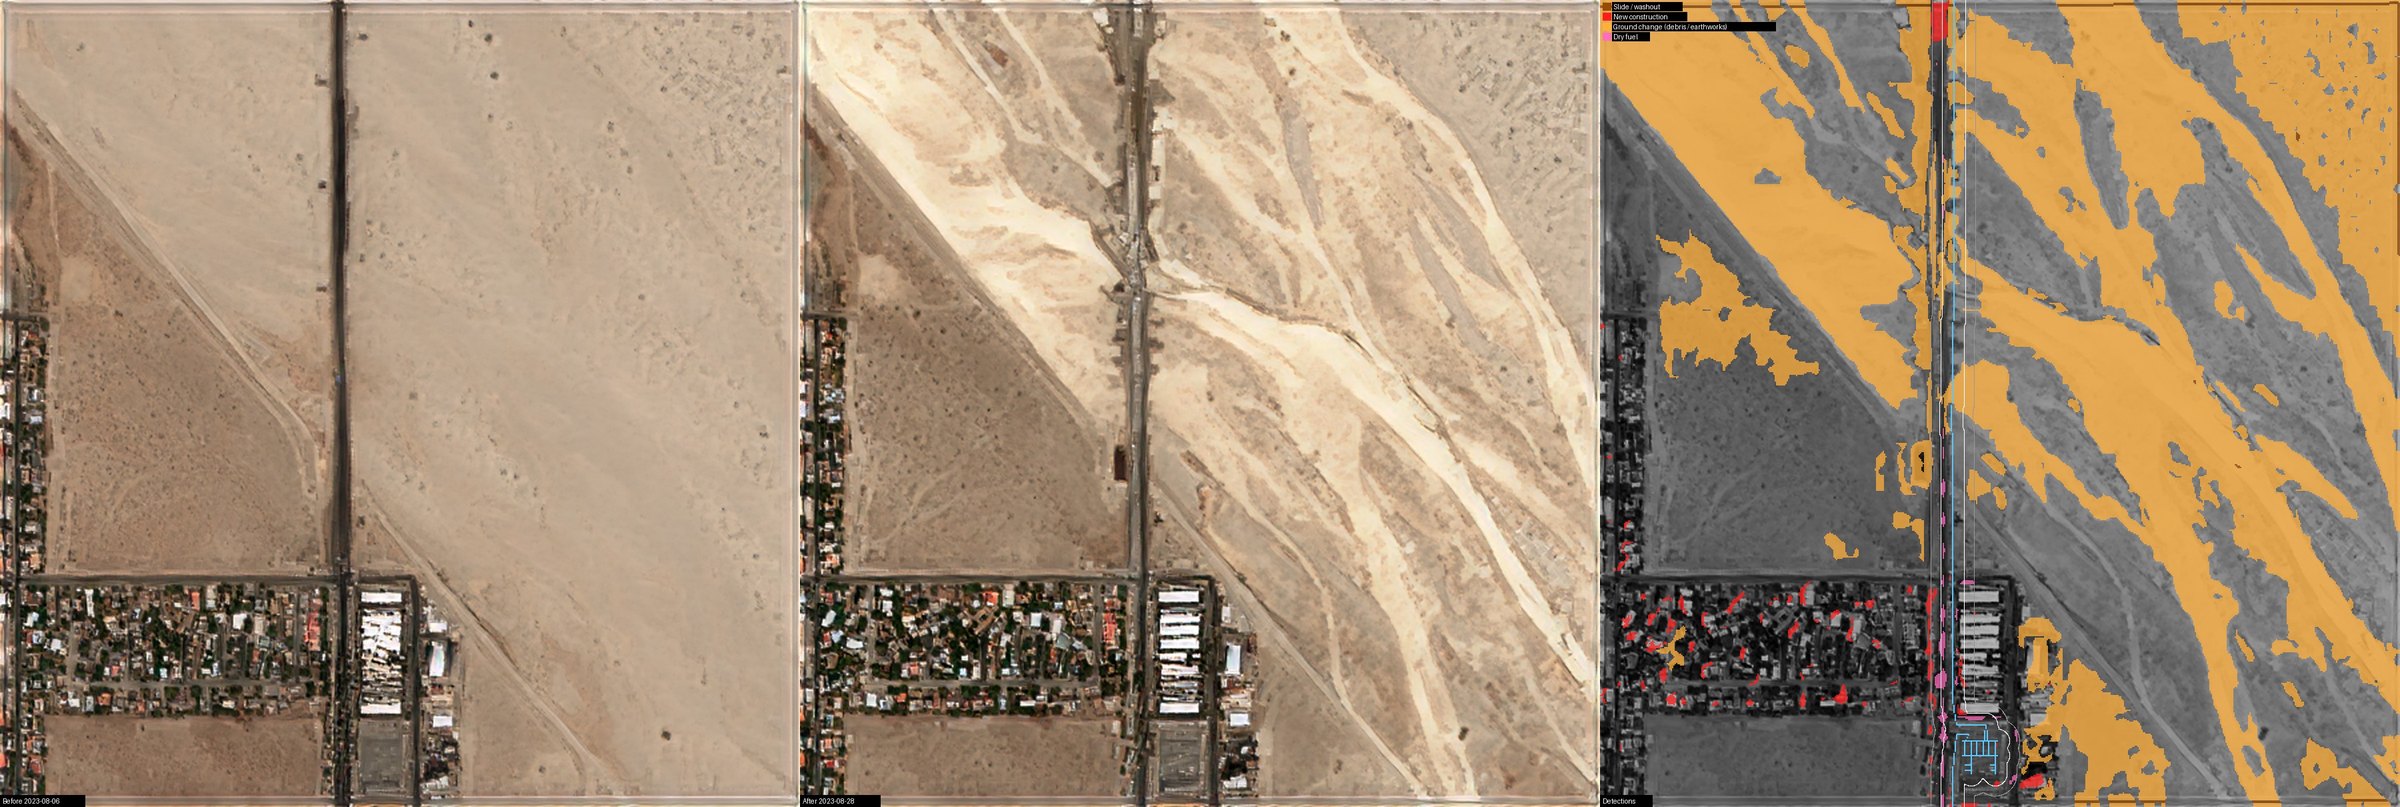
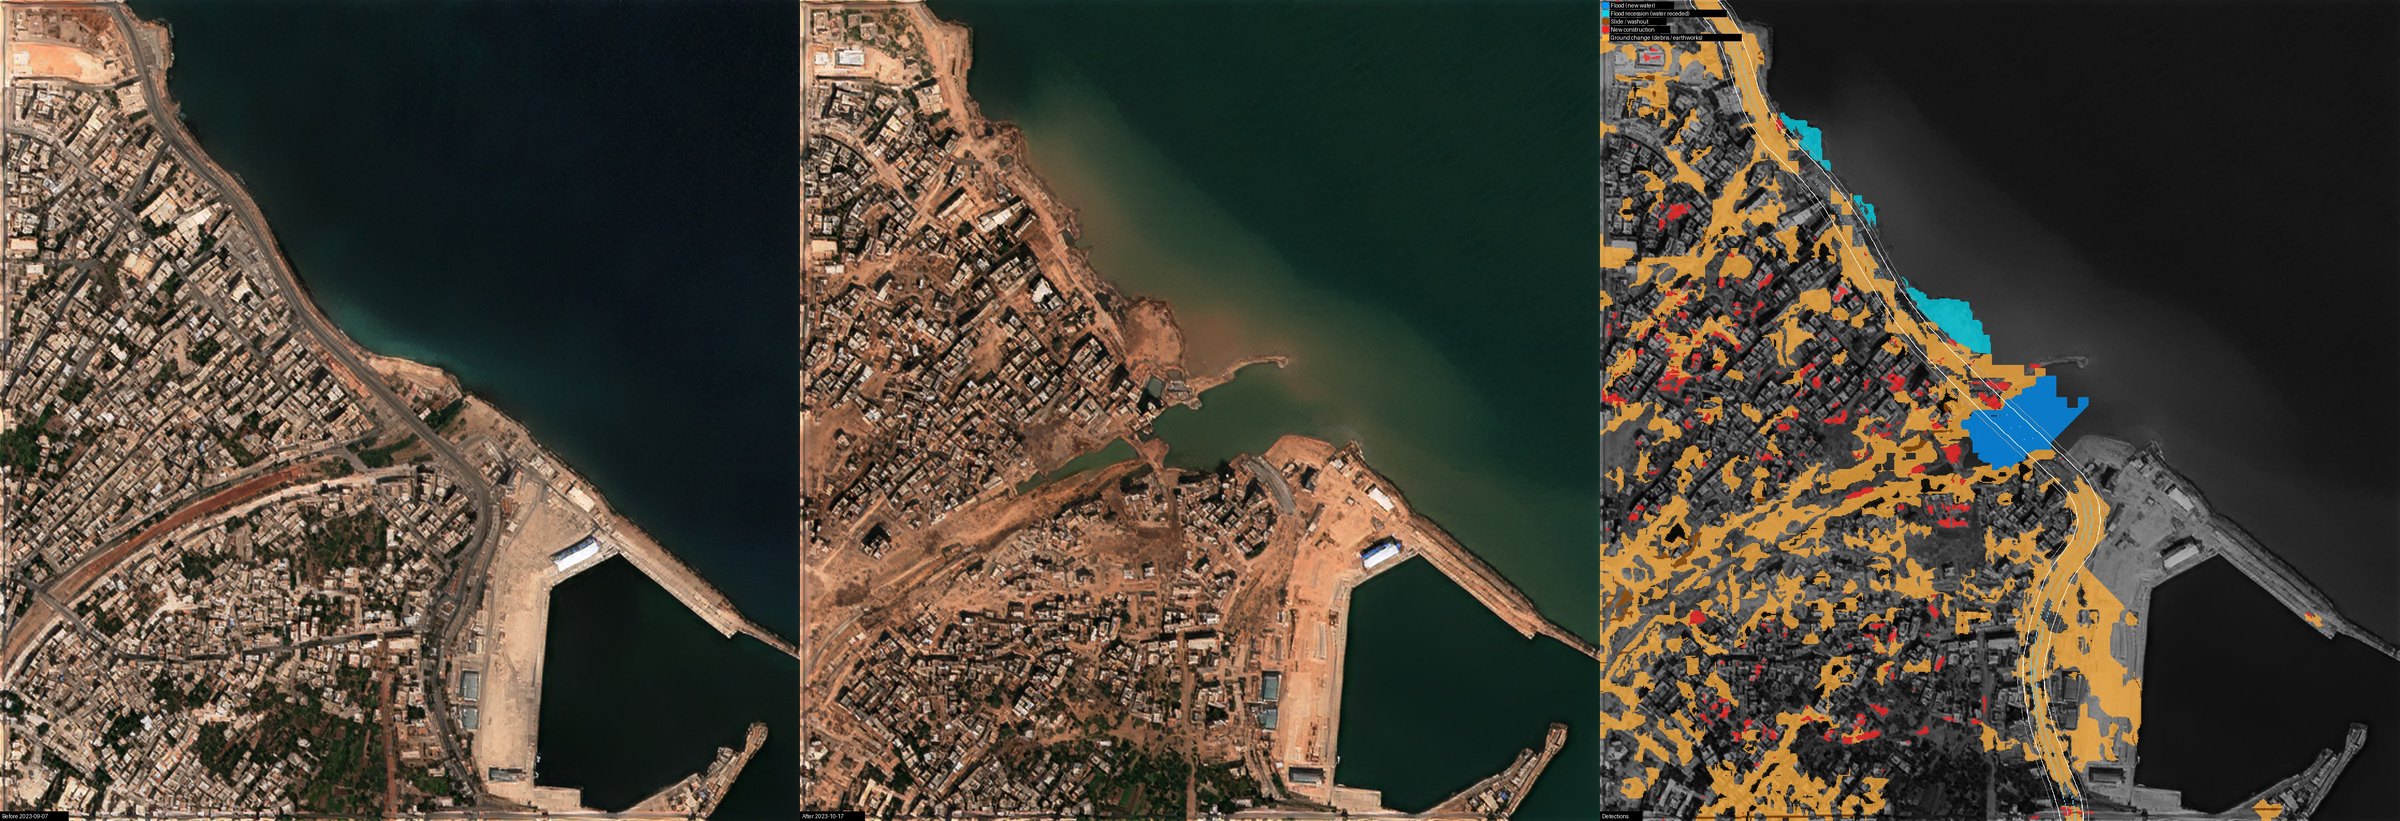
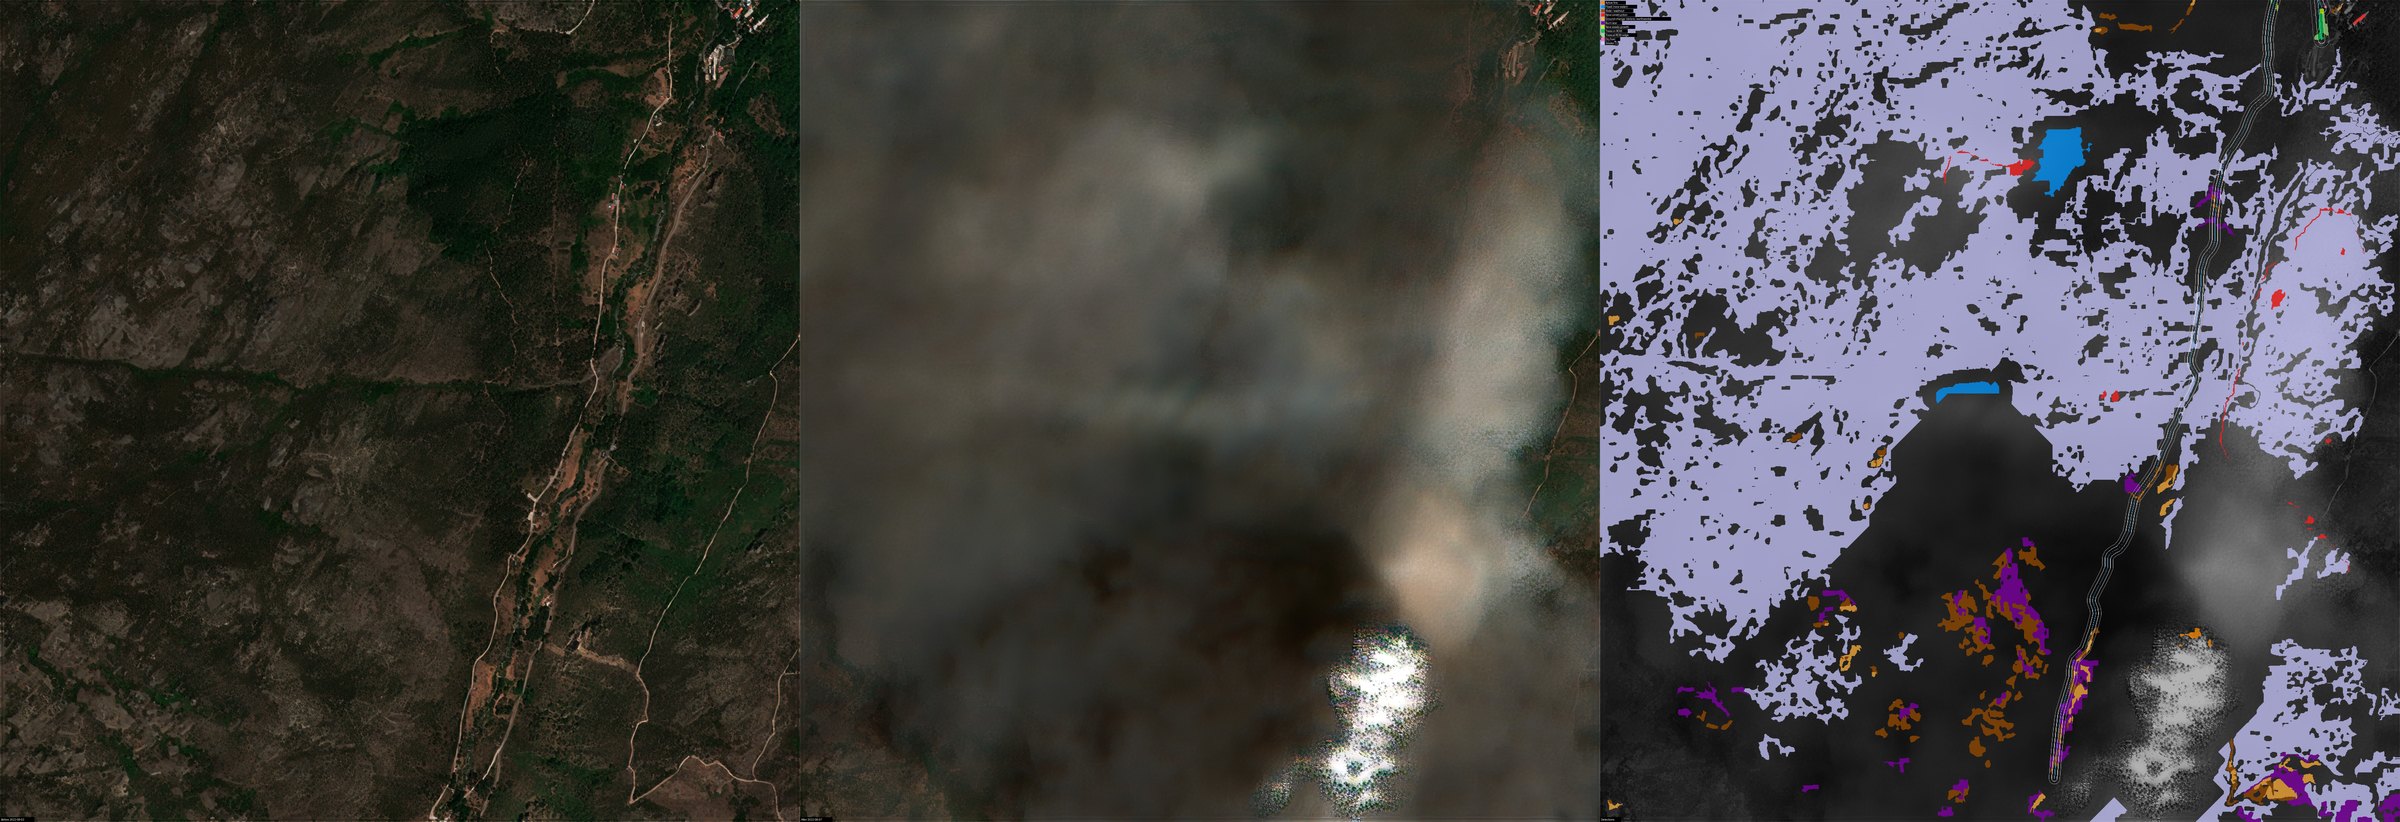
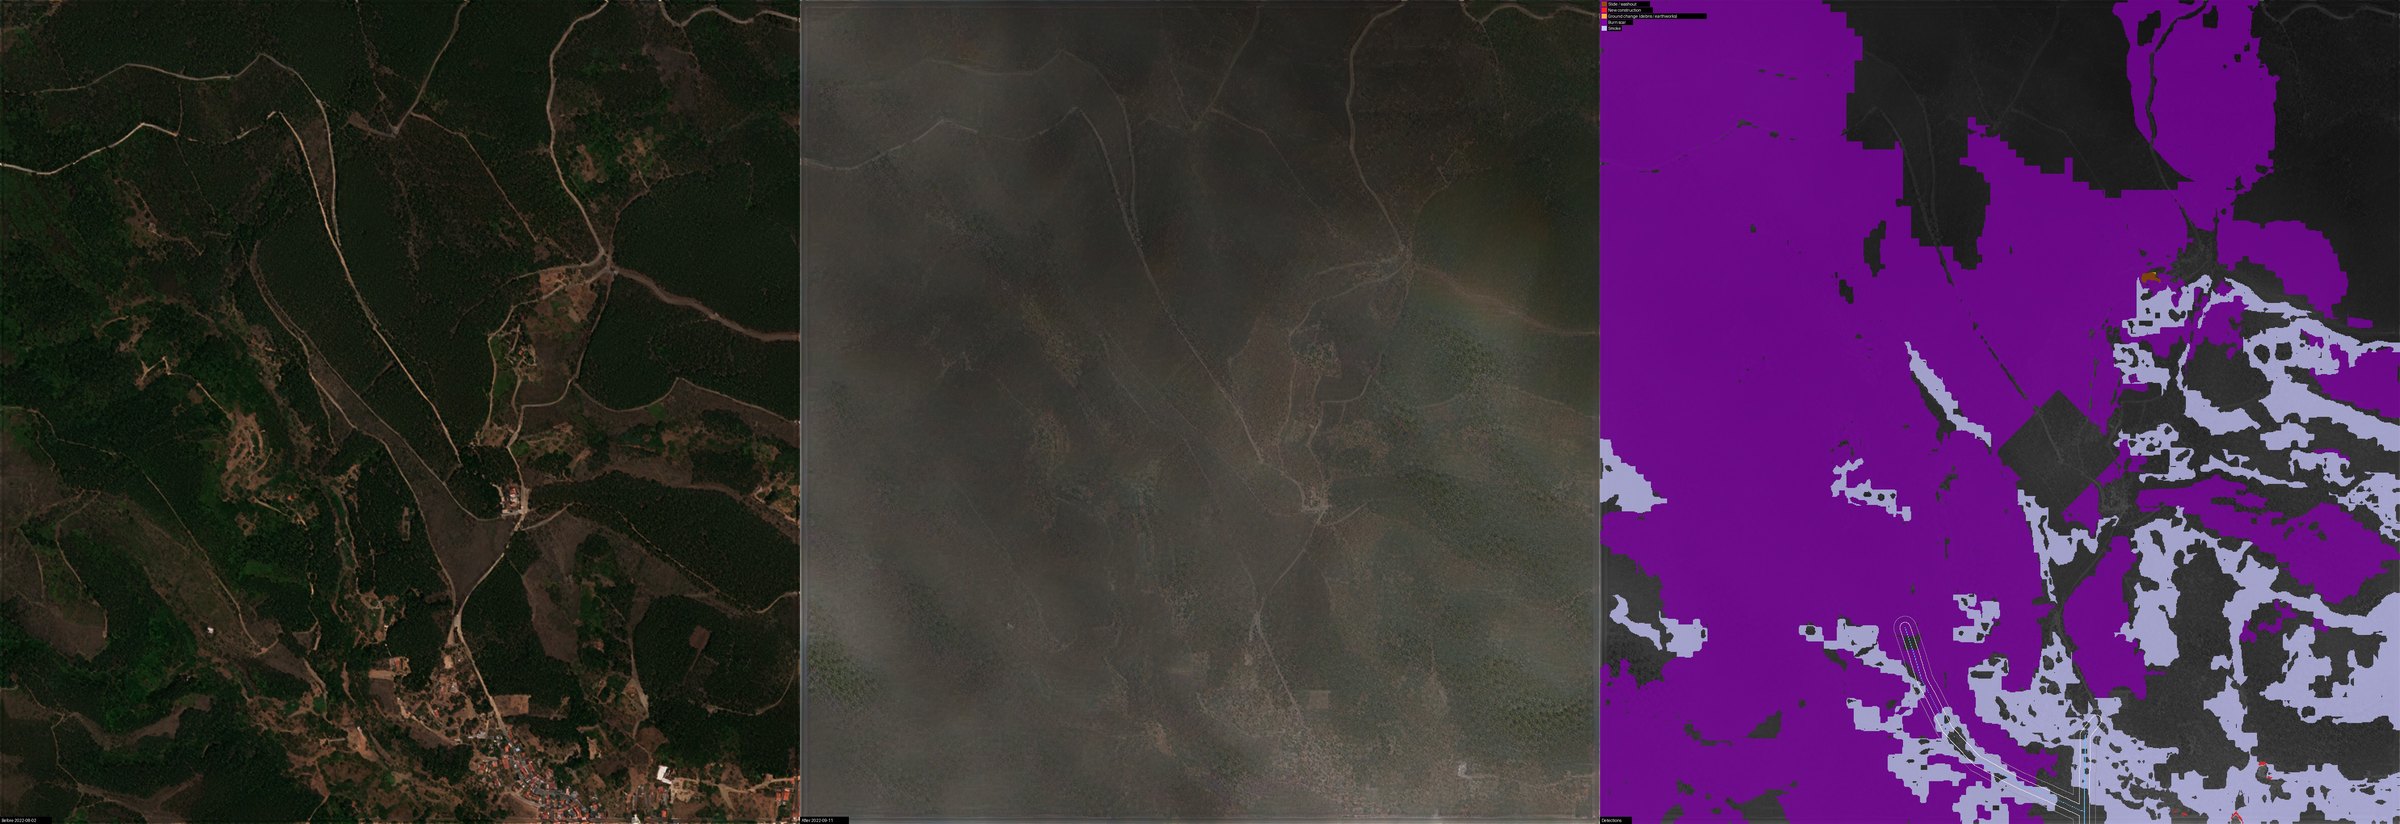
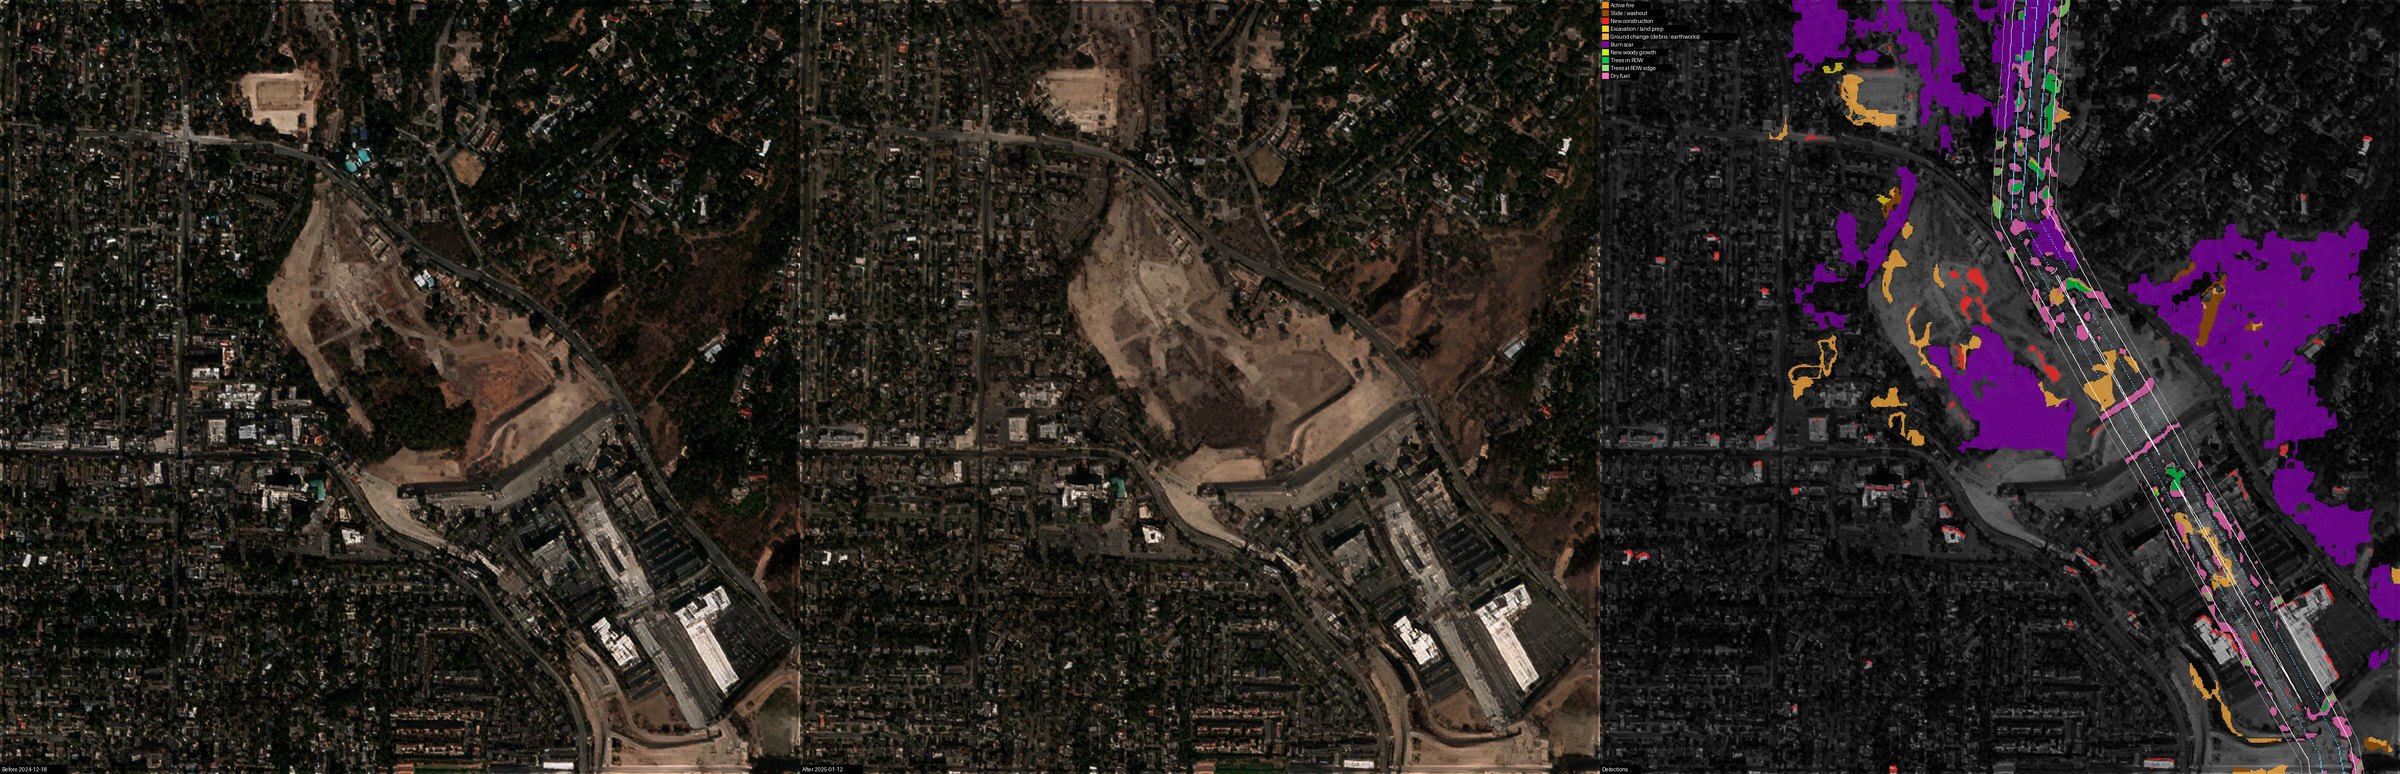
Corridor monitoring is the responsibility of many organizations owning a pathway along significant stretches, most of which have Right of Way (ROW) over their corridor. Critical site monitoring has a similar responsibility over a large number of isolated installations.
Corridor operators include:
- Railroads
- Highways
- Water authorities
- Electricity transmission
- Gas and oil pipelines
- Rivers
- Fiber-optic cables
Critical site operators include:
- Seaports and airports
- Communication operators like cellular
- Electricity sub-stations
- Military camps, airfields, seaports and other installations
All of these operators have a need and often obligations to monitor and handle a wide range of changes at or near the locations they are responsible for, including:
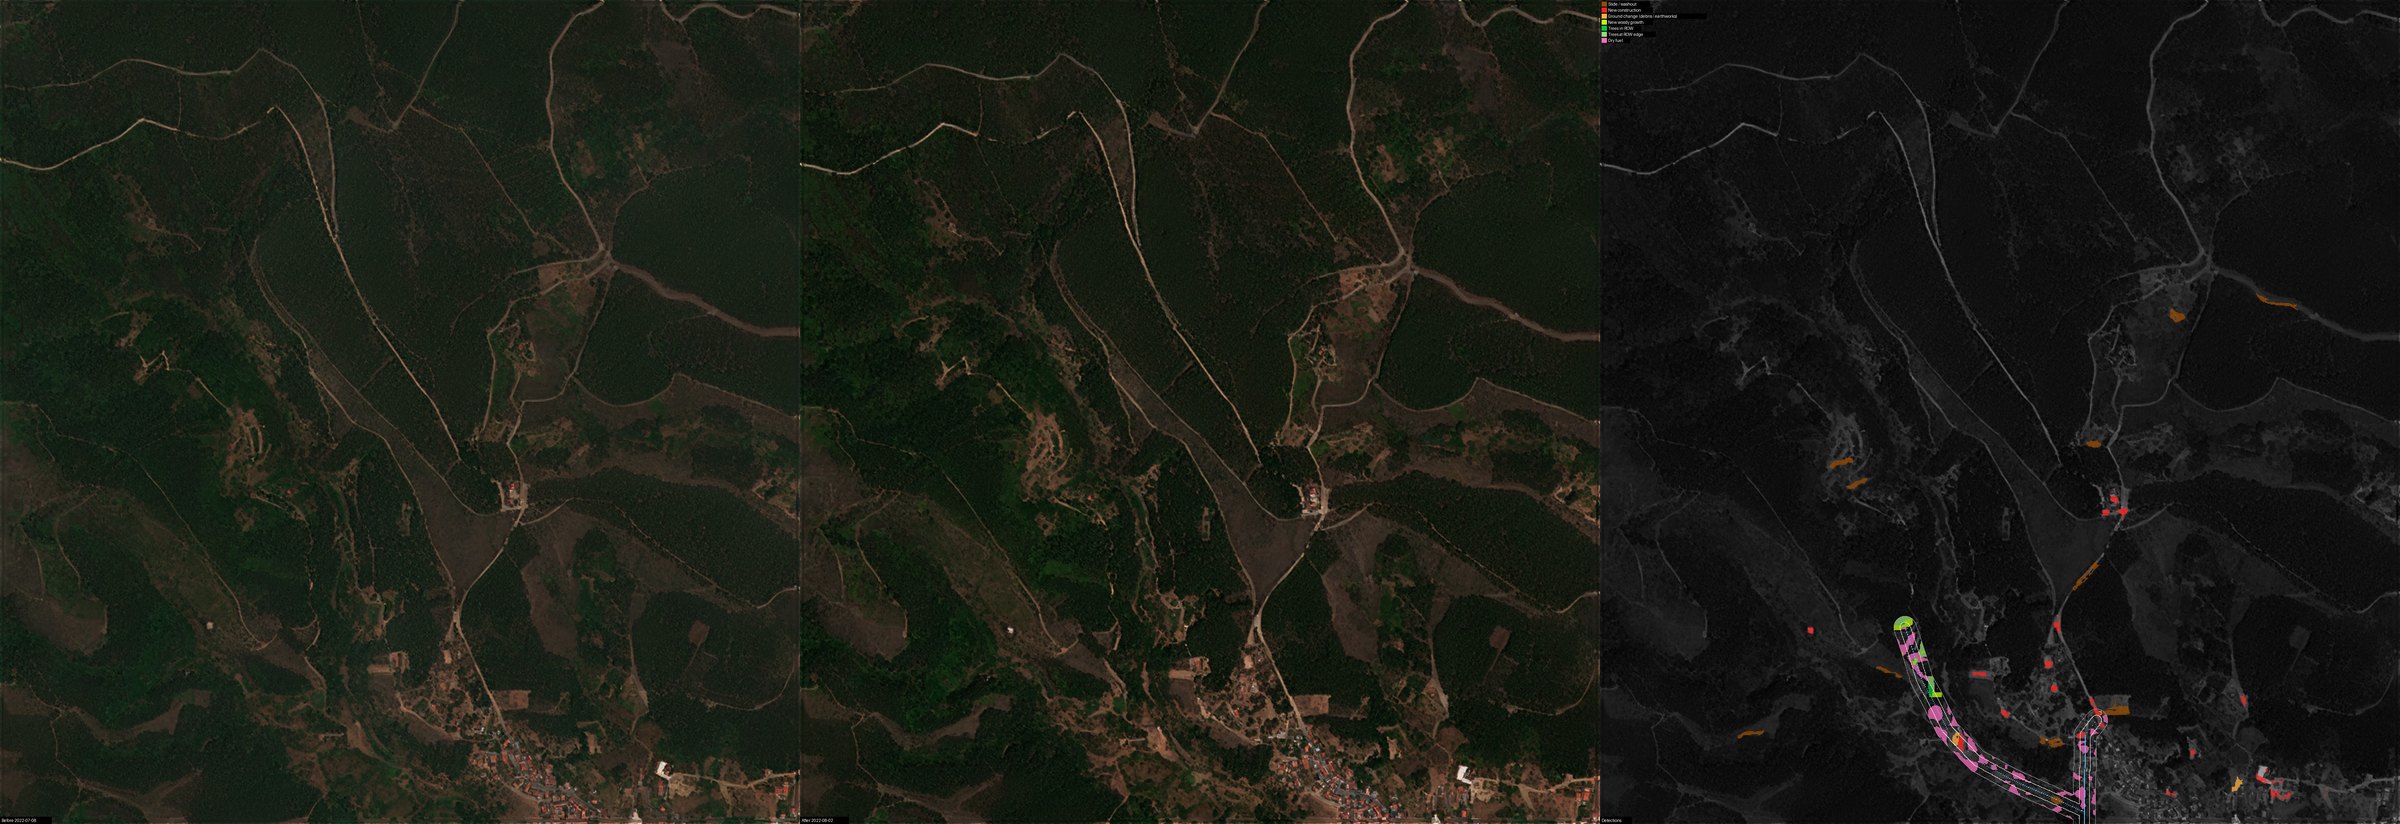
- New construction (often not theirs and illegal)
- Vegetation encroachment
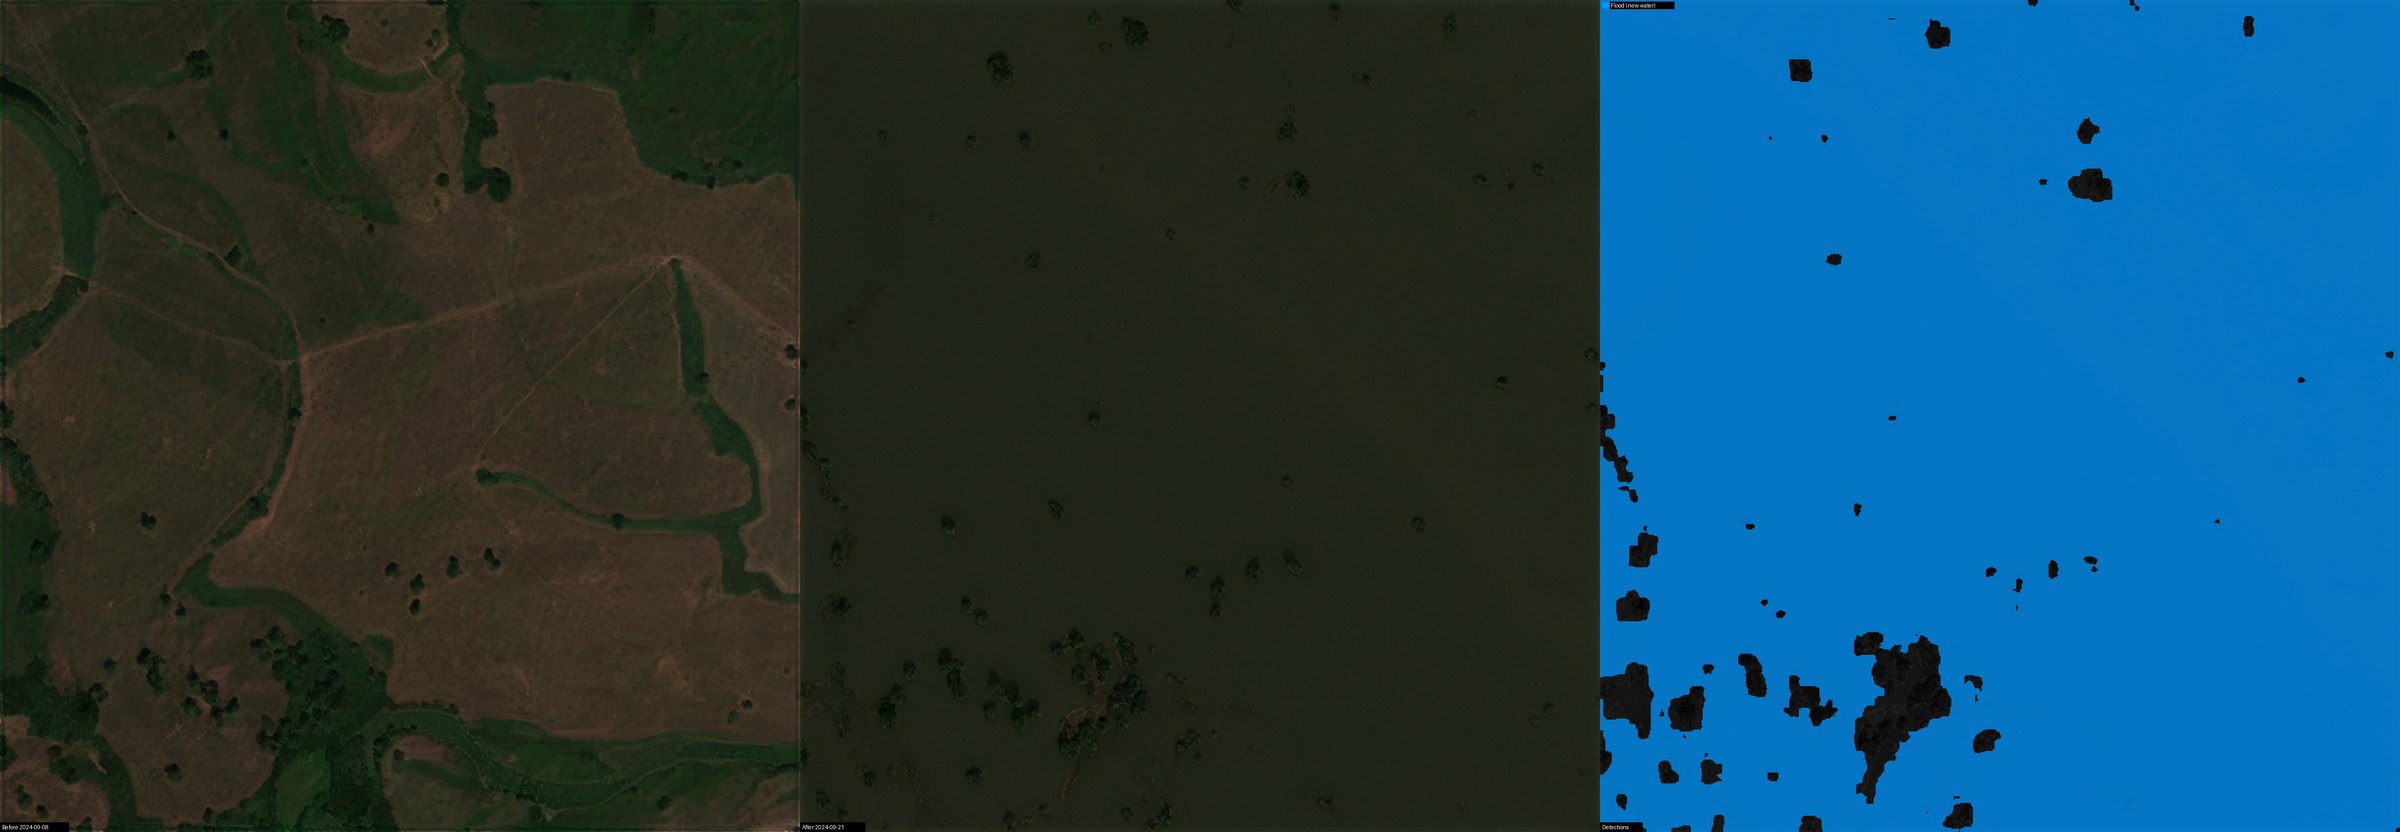
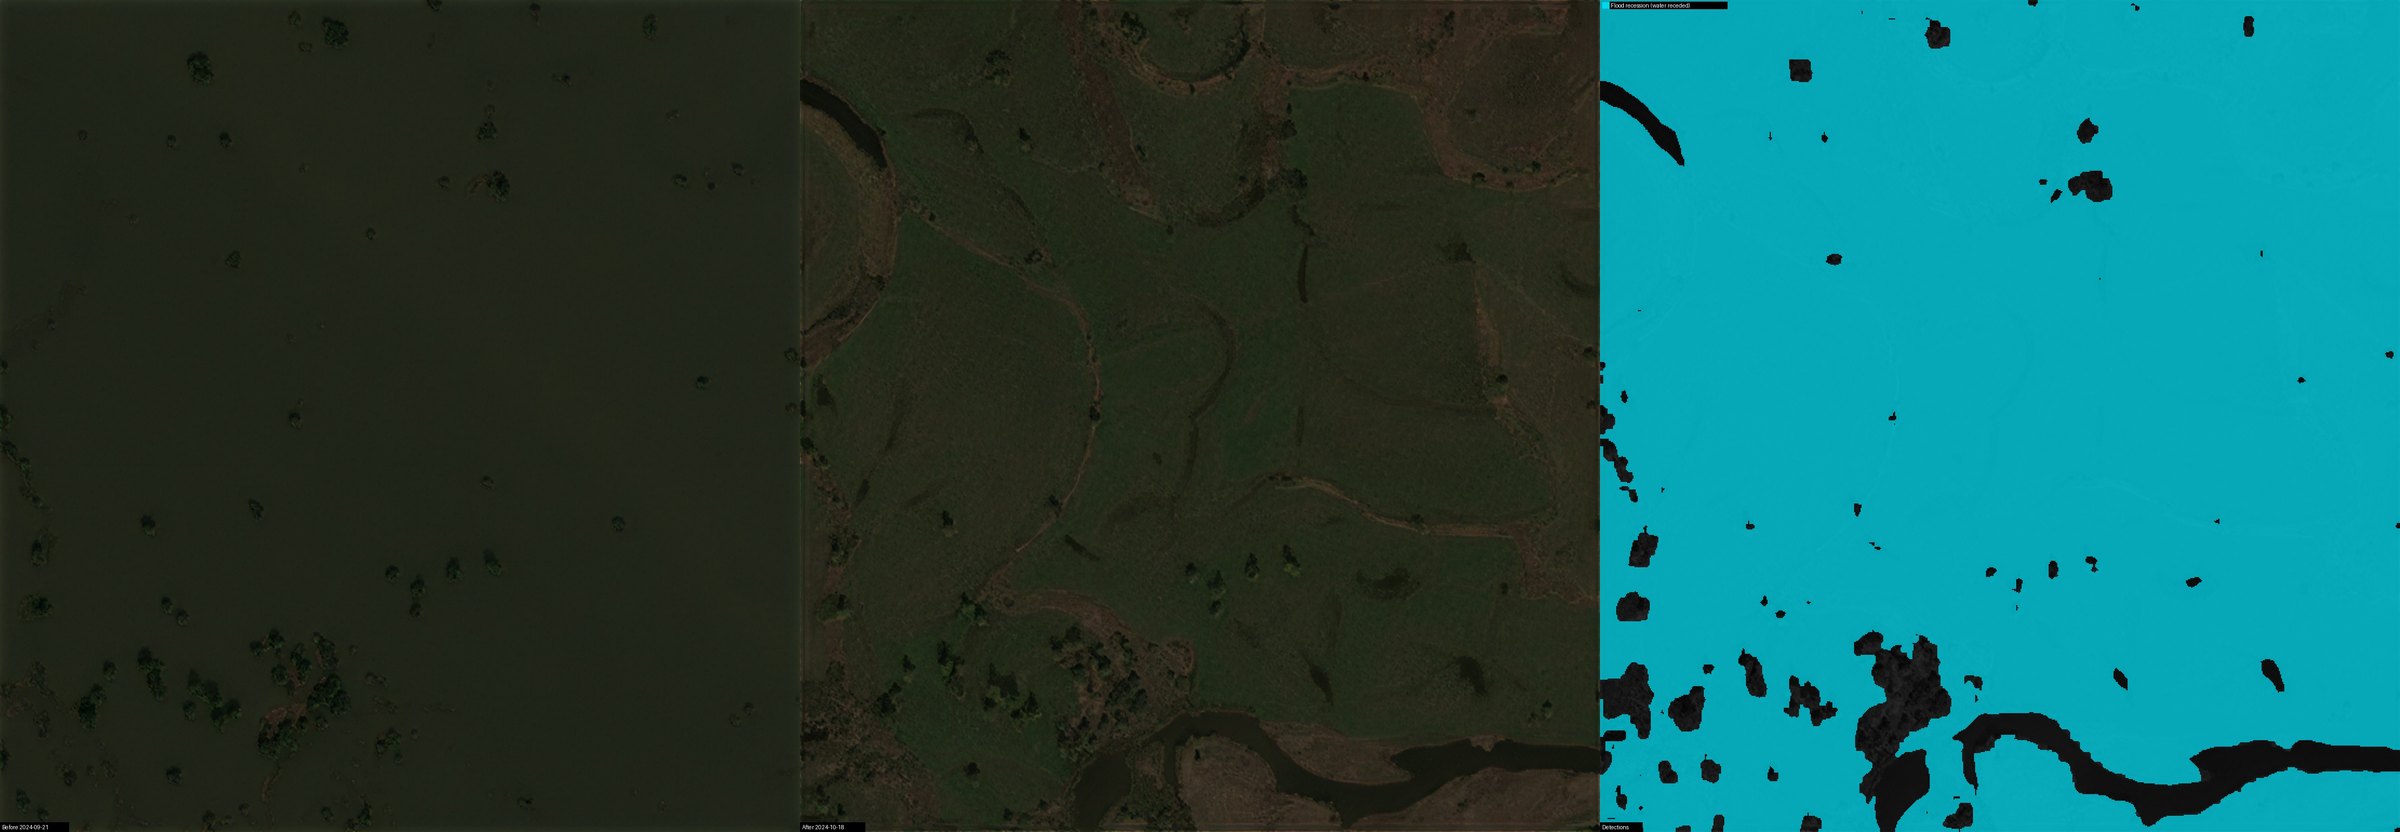
- Floods
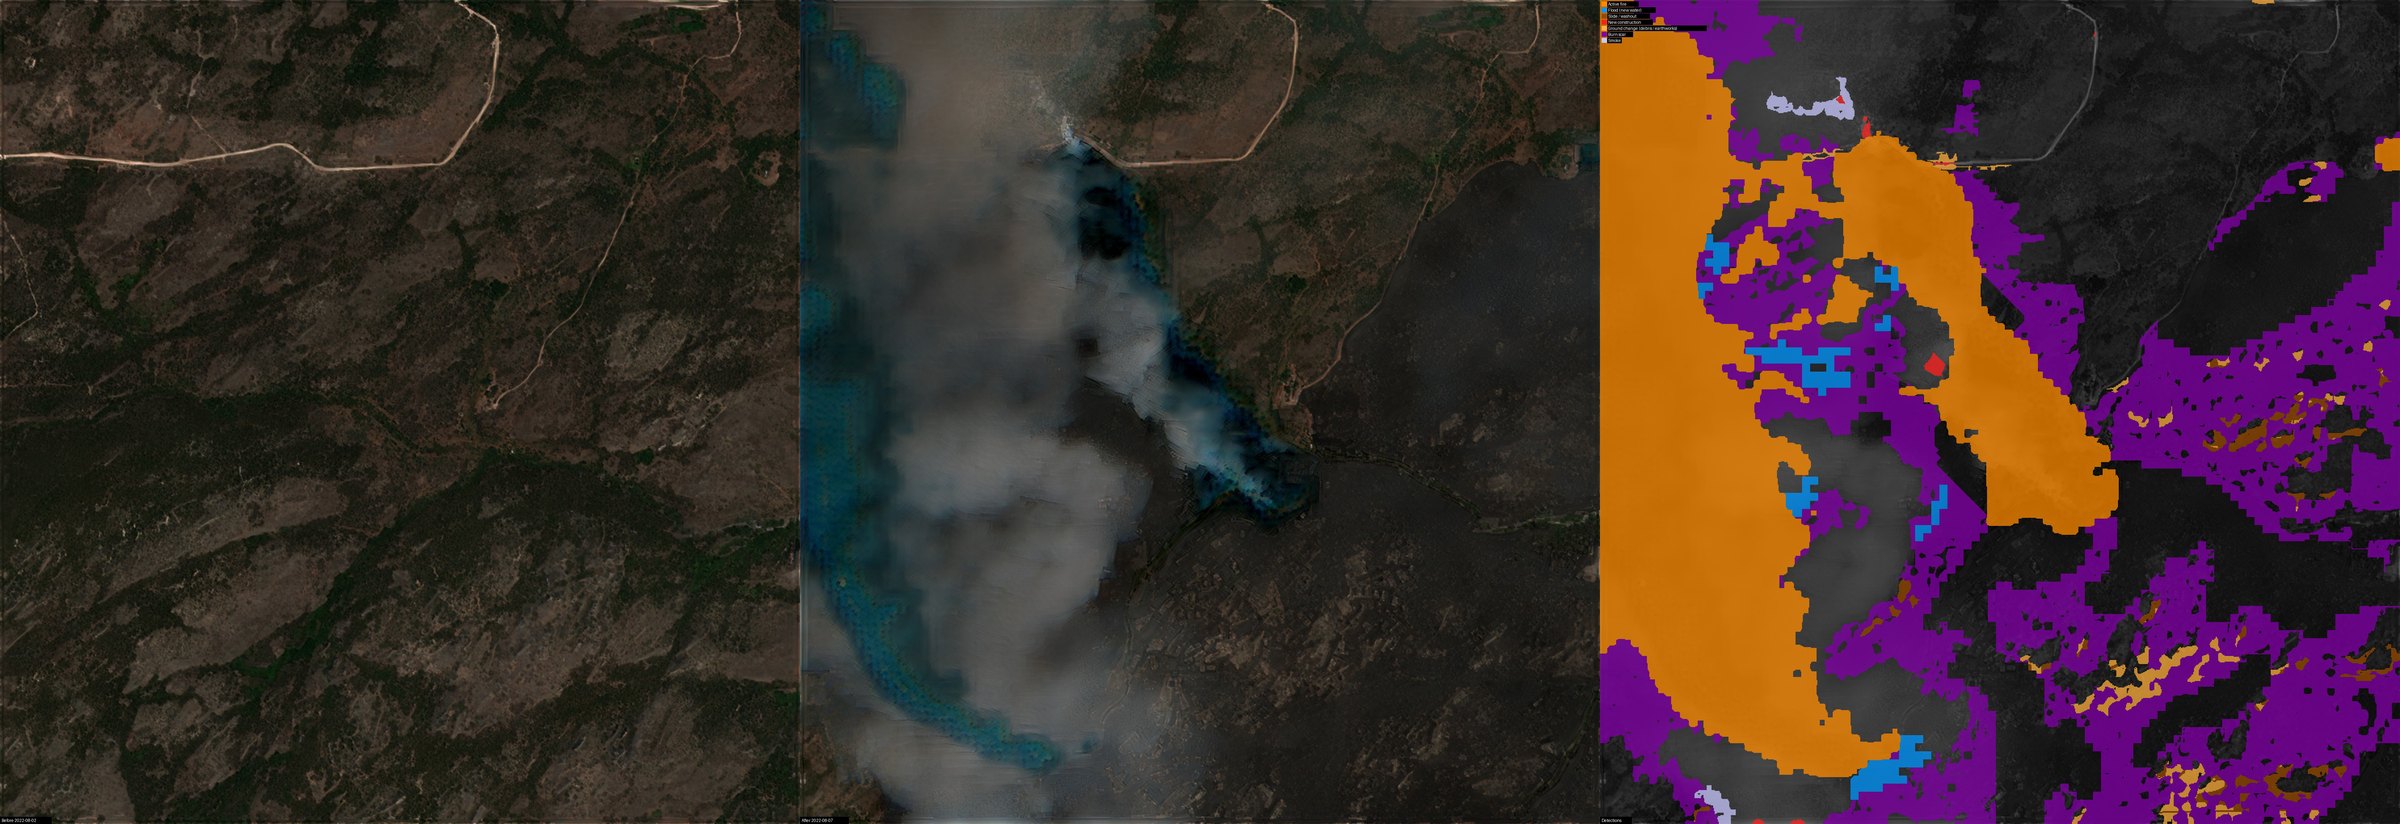
- Fires (active or recent) and fire hazards (such as dry vegetation)
- Rock and mud slides
- Erosion and washouts
- Third-party excavation and digging
- New unauthorized access roads and tracks
- Leaks and spills (water, oil)
- Illegal tapping and fuel theft
- Illegal dumping
- Sand encroachment (desert roads and railways)
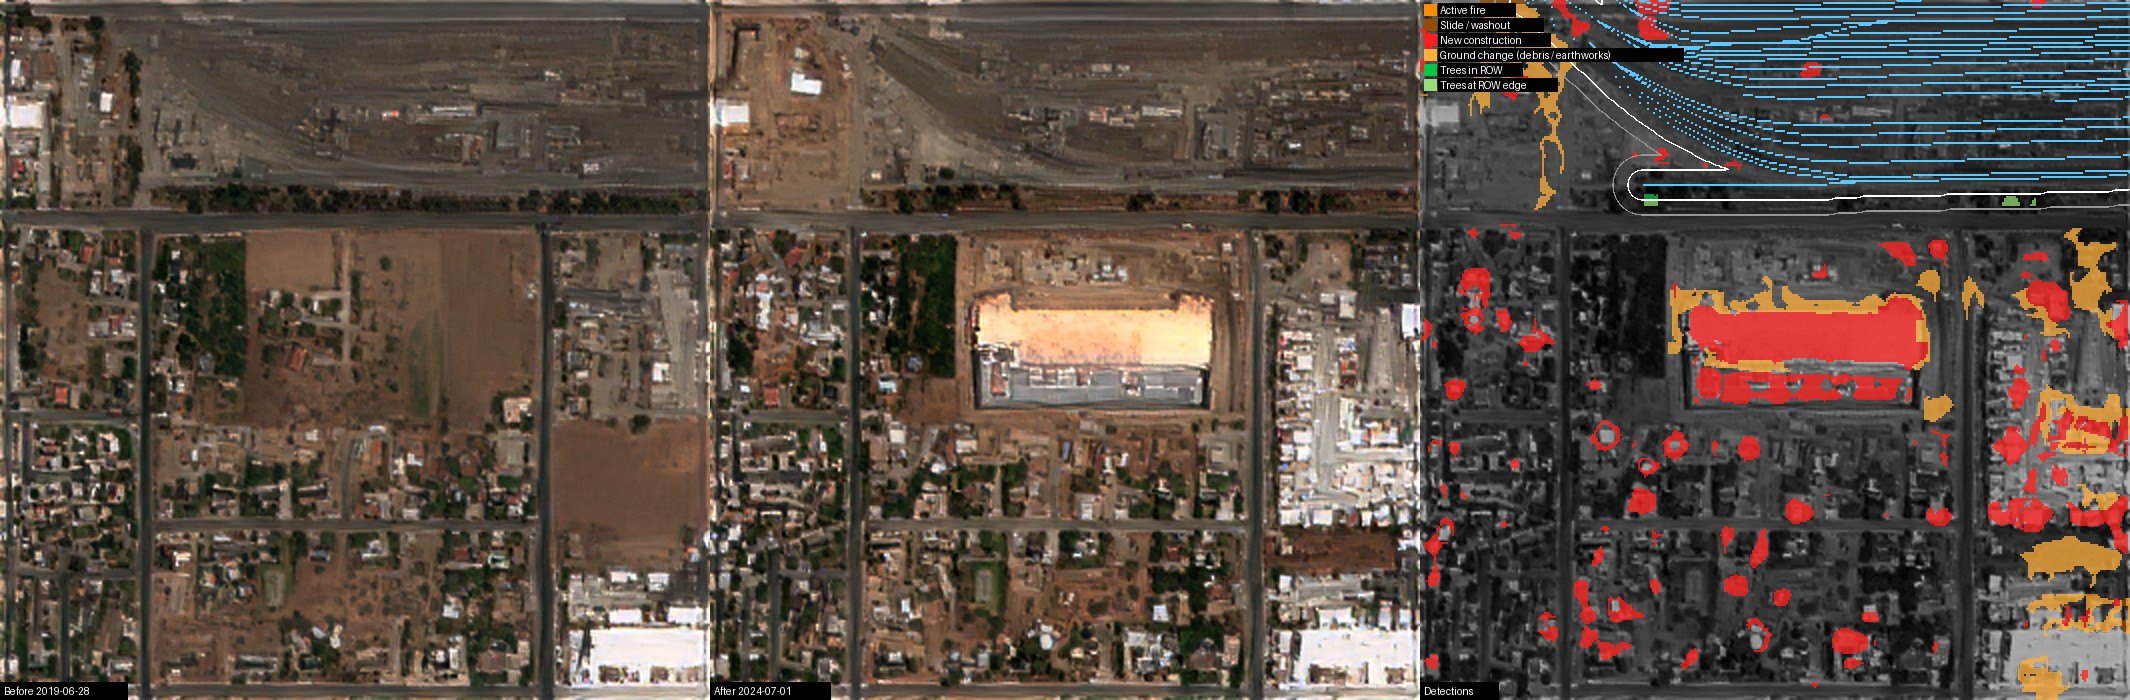
Some of these, such as new construction, are flagged automatically; for the others, EarthToDate's frequent, up-to-date imagery lets you inspect your corridors and sites yourself, as often as you need.
Not supported at this time:
- Automatic detection of illegal dumping, sand encroachment, new access tracks, fuel theft and leaks (planned)
- Not feasible with this data: ground subsidence, buried pipe condition, conductor clearance height, events under cloud, tower faults, real-time intrusion and pipeline methane
The leading cause of pipeline failures is third-party interference — unauthorized digging, construction and machinery on the right-of-way. EarthToDate New Construction Detection flags new buildings, and its land preparation class catches clearing and grading, often the earliest warning before a dig. Separating greenhouses keeps farm plastic from being mistaken for encroachment where corridors cross farmland.
For power lines, vegetation growing into the conductor clearance zone is a leading cause of outages and wildfire ignition (regulated in the US under NERC FAC-003). EarthToDate flags where vegetation is present and growing; the clearance height itself needs LiDAR or stereo imagery.
Limits: optical imagery sees surface signs only — not buried-pipe condition or millimetre-scale ground motion, which need radar interferometry (InSAR) — and a dig opened and backfilled between passes can be missed. Slow threats such as regrowth, equipment staging, erosion and creeping encroachment are where continuous screening is strongest.
Suspected Underground Water Leak Warnings
Water utilities lose about a third of the water they supply before it reaches users — an average of 35% in urban systems, about 126 billion m³ a year worldwide. Various methods are employed, such as water pressure sensors, but the problem is still very much present. A single service provider, ASTERRA, employs tasking satellites with limited ground-penetrating capabilities (L-band SAR from Japan's ALOS-2 and Argentina's SAOCOM), provides localized analysis of potential underground water leaks and serves over 600 water utilities in 68 countries.
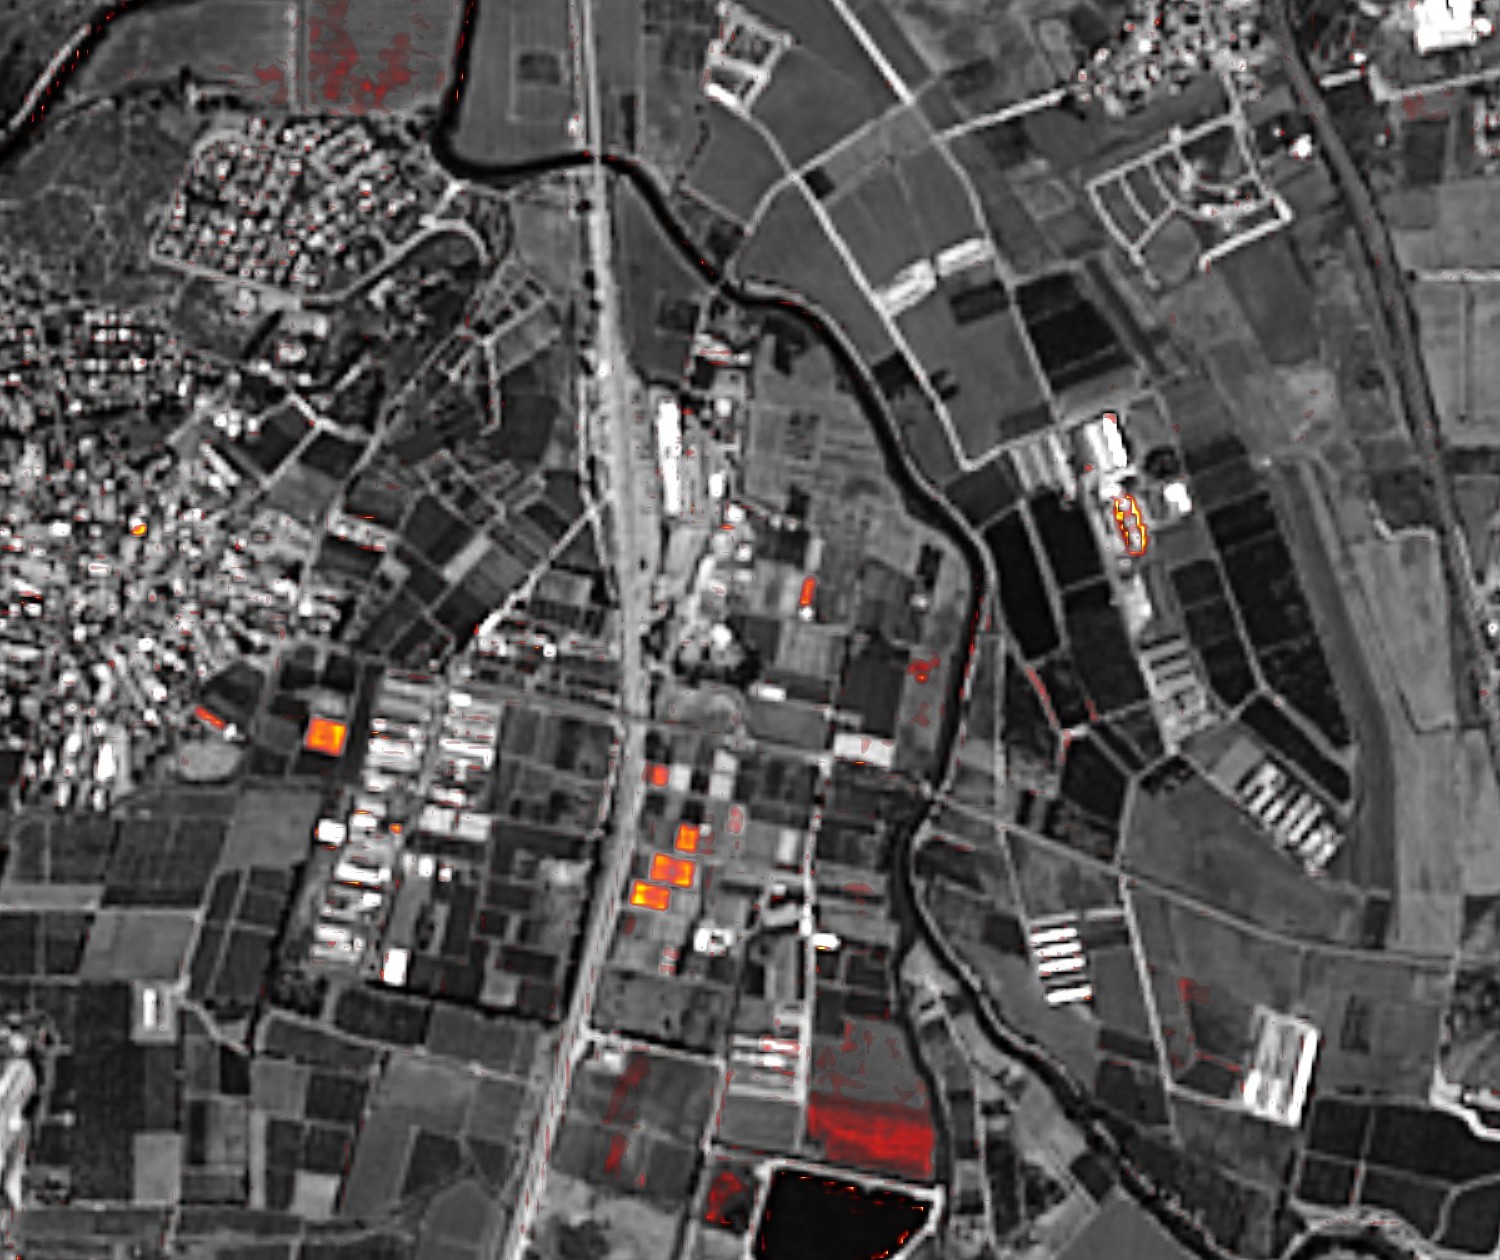
EarthToDate underground water leak warning takes a different approach, and is suitable for national-scale continuous monitoring. It employs the concept of high-resolution detection of increased soil moisture. With EarthToDate unique 2m multispectral data, EarthToDate continuously monitors recent imagery against its near previous one, looking for an increase in local moisture along the underground pipes. When not local, the assumption is weather conditions like rain, but local increase may warn of an underground leak. Naturally, such a method has limitations and requires relatively exposed ground, with construction or thick vegetation limiting the reading.
Water Quality
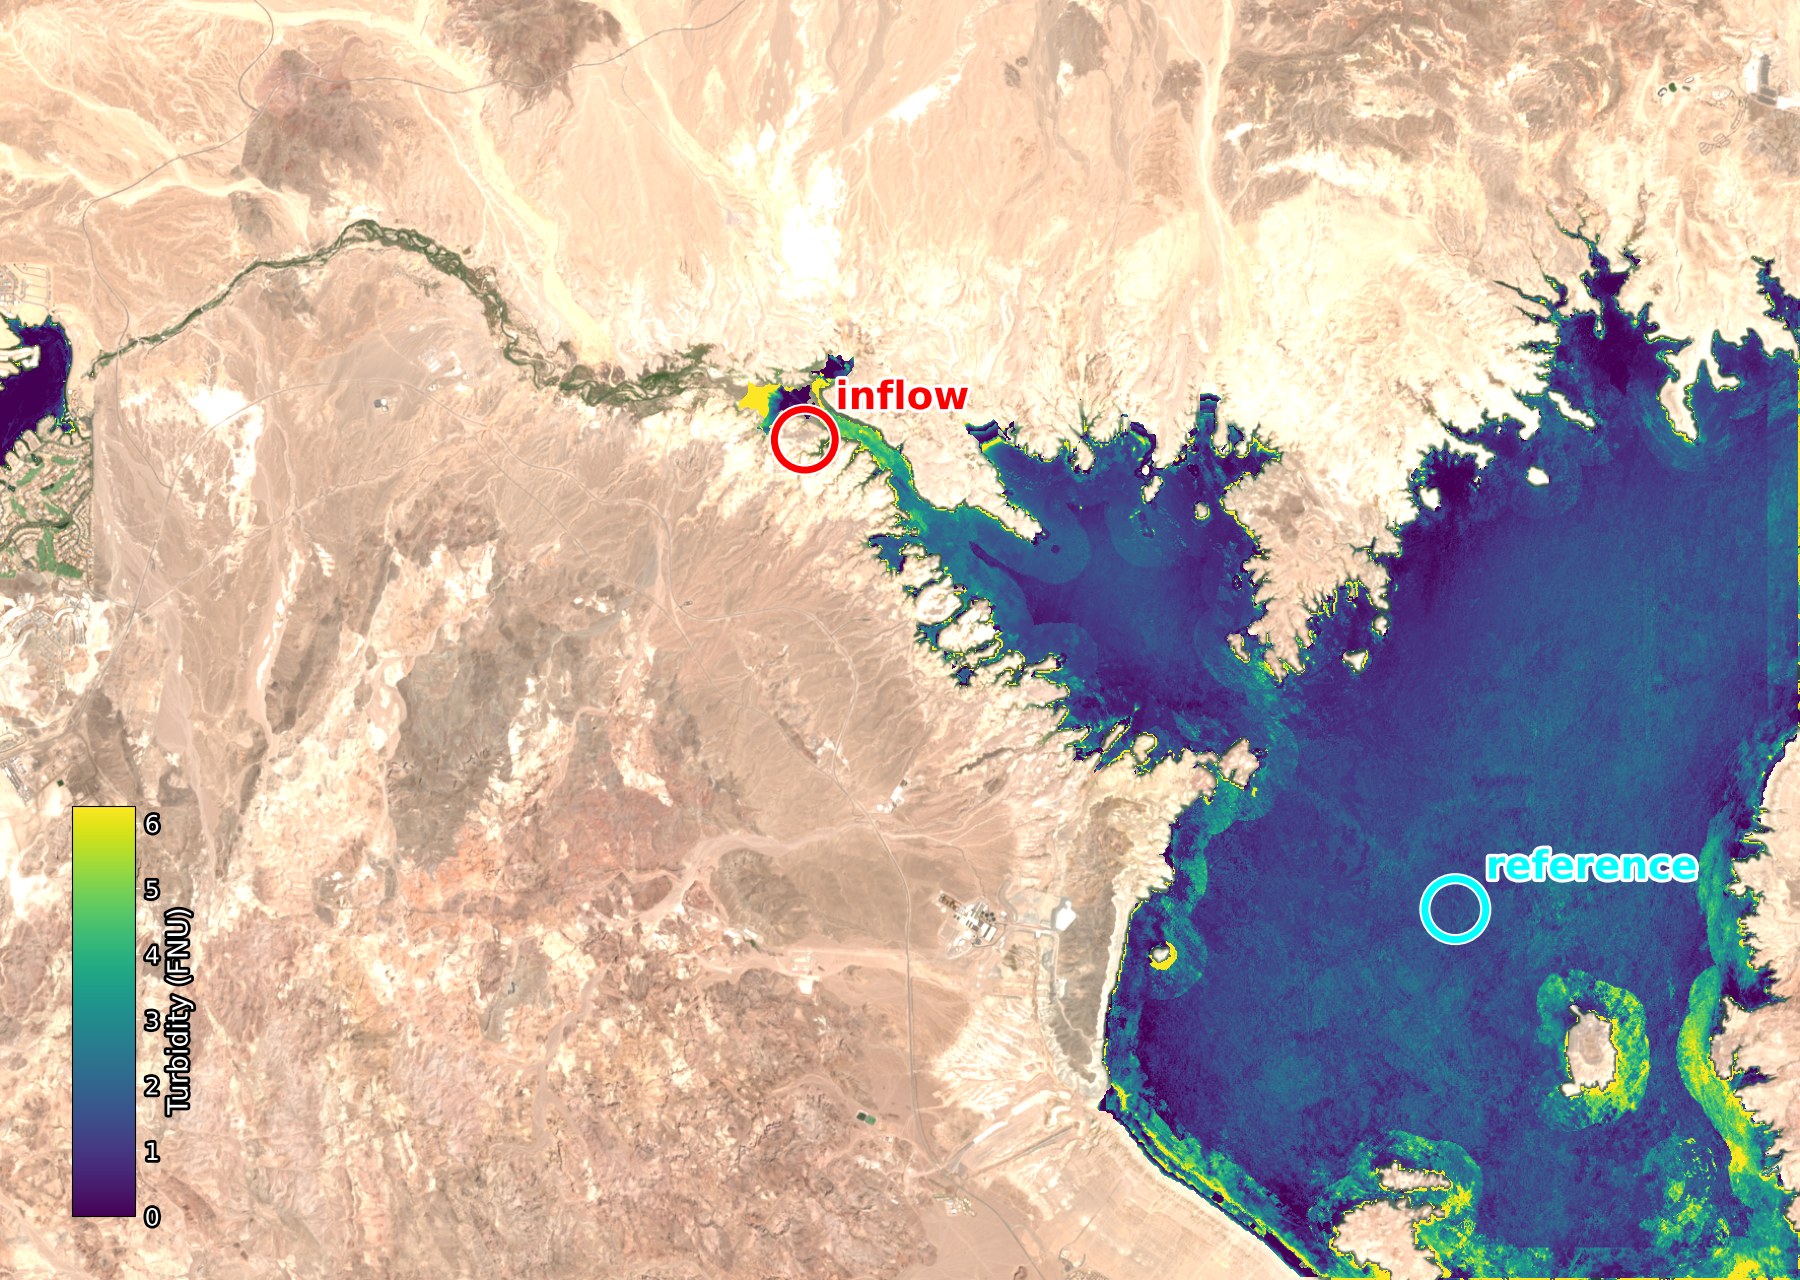
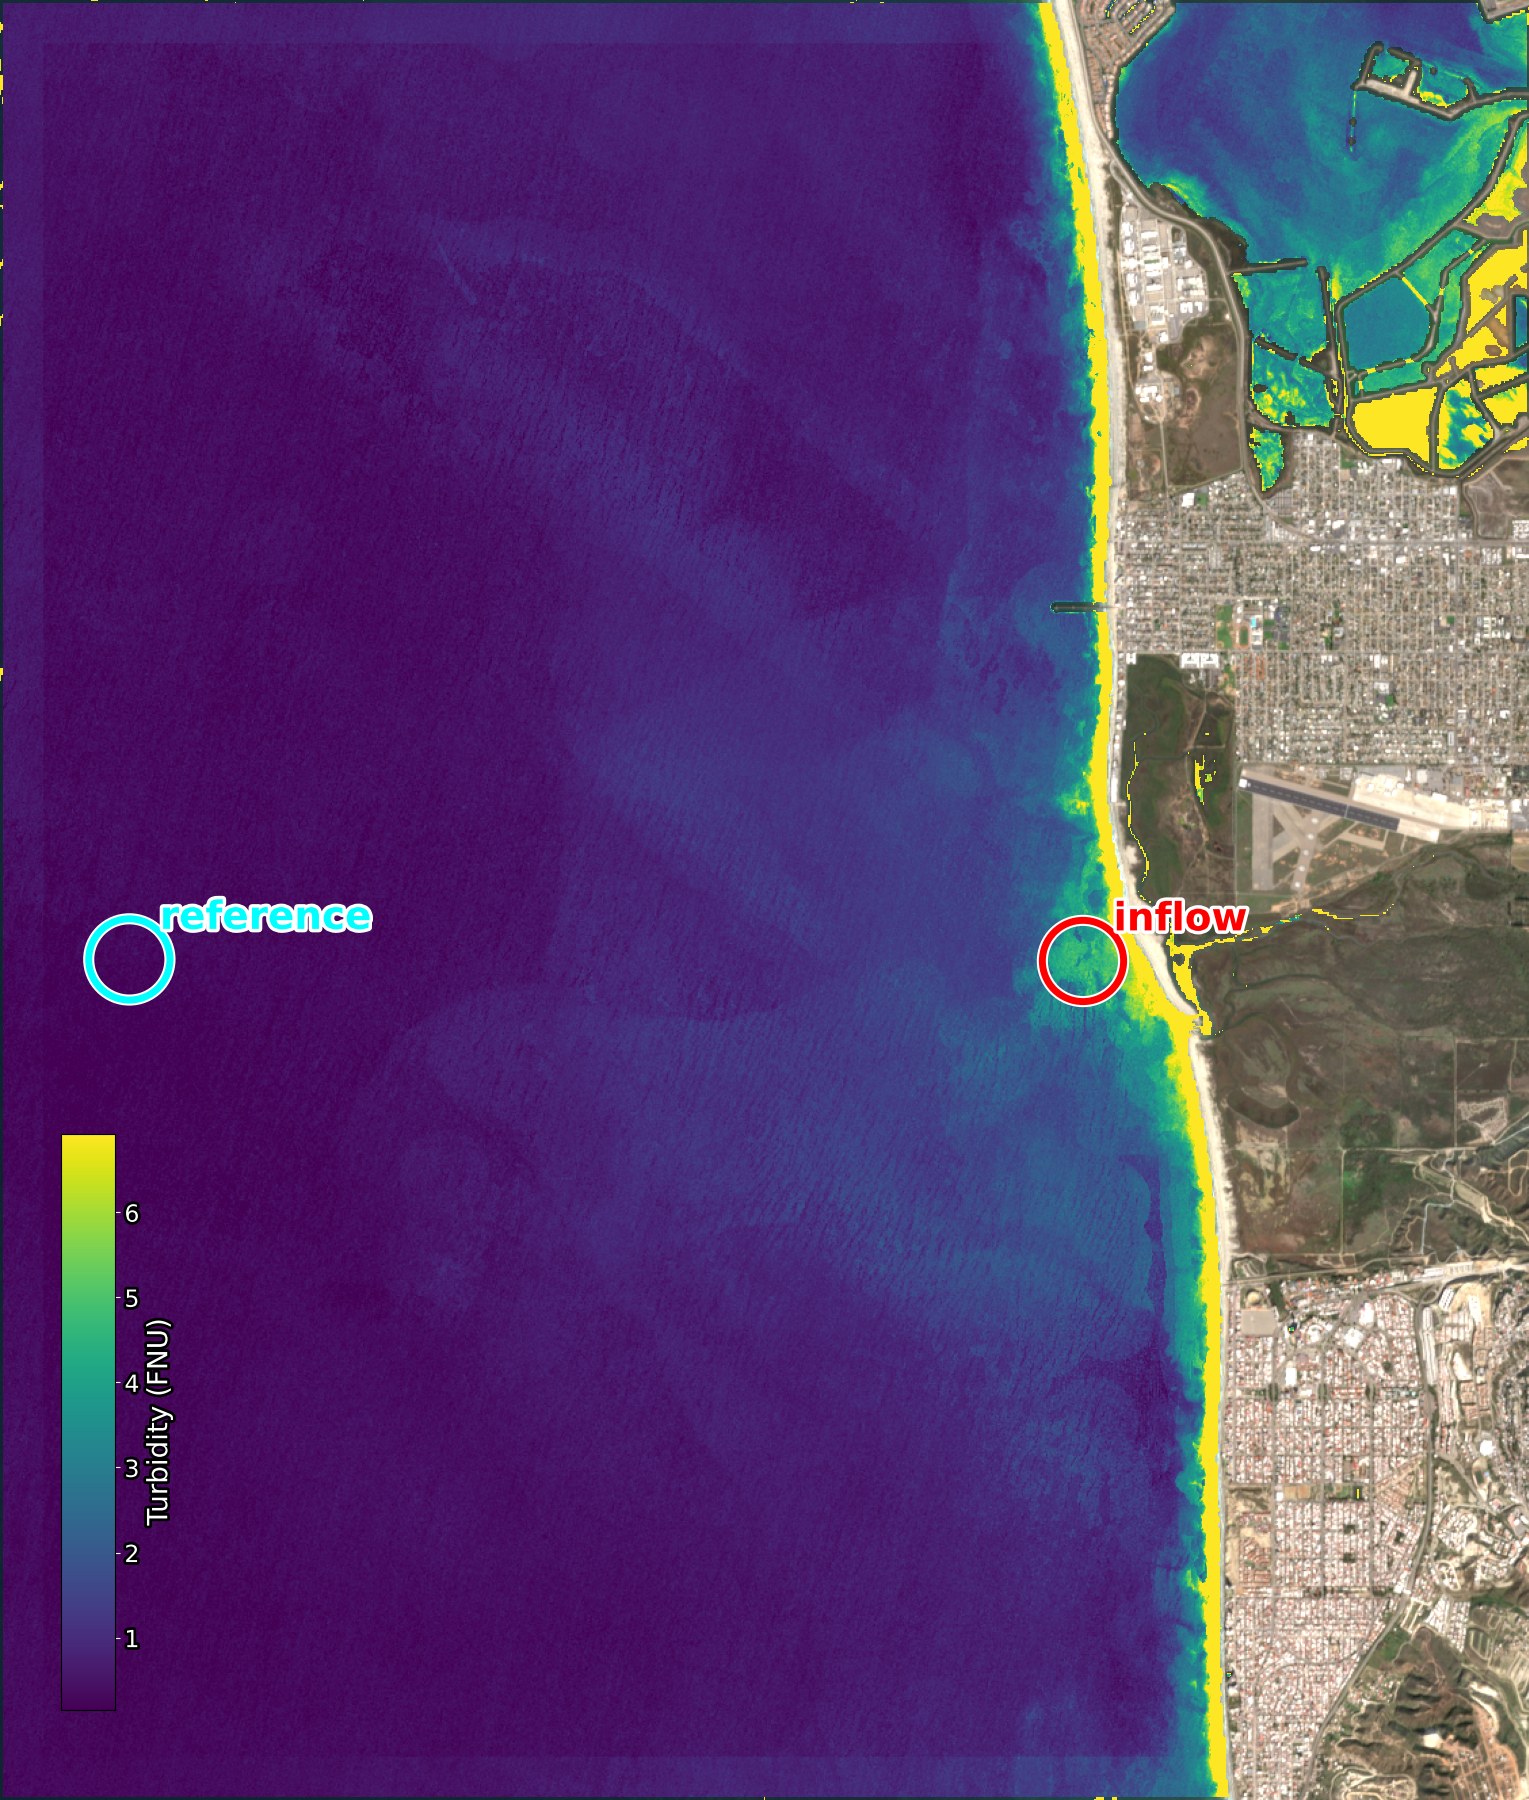
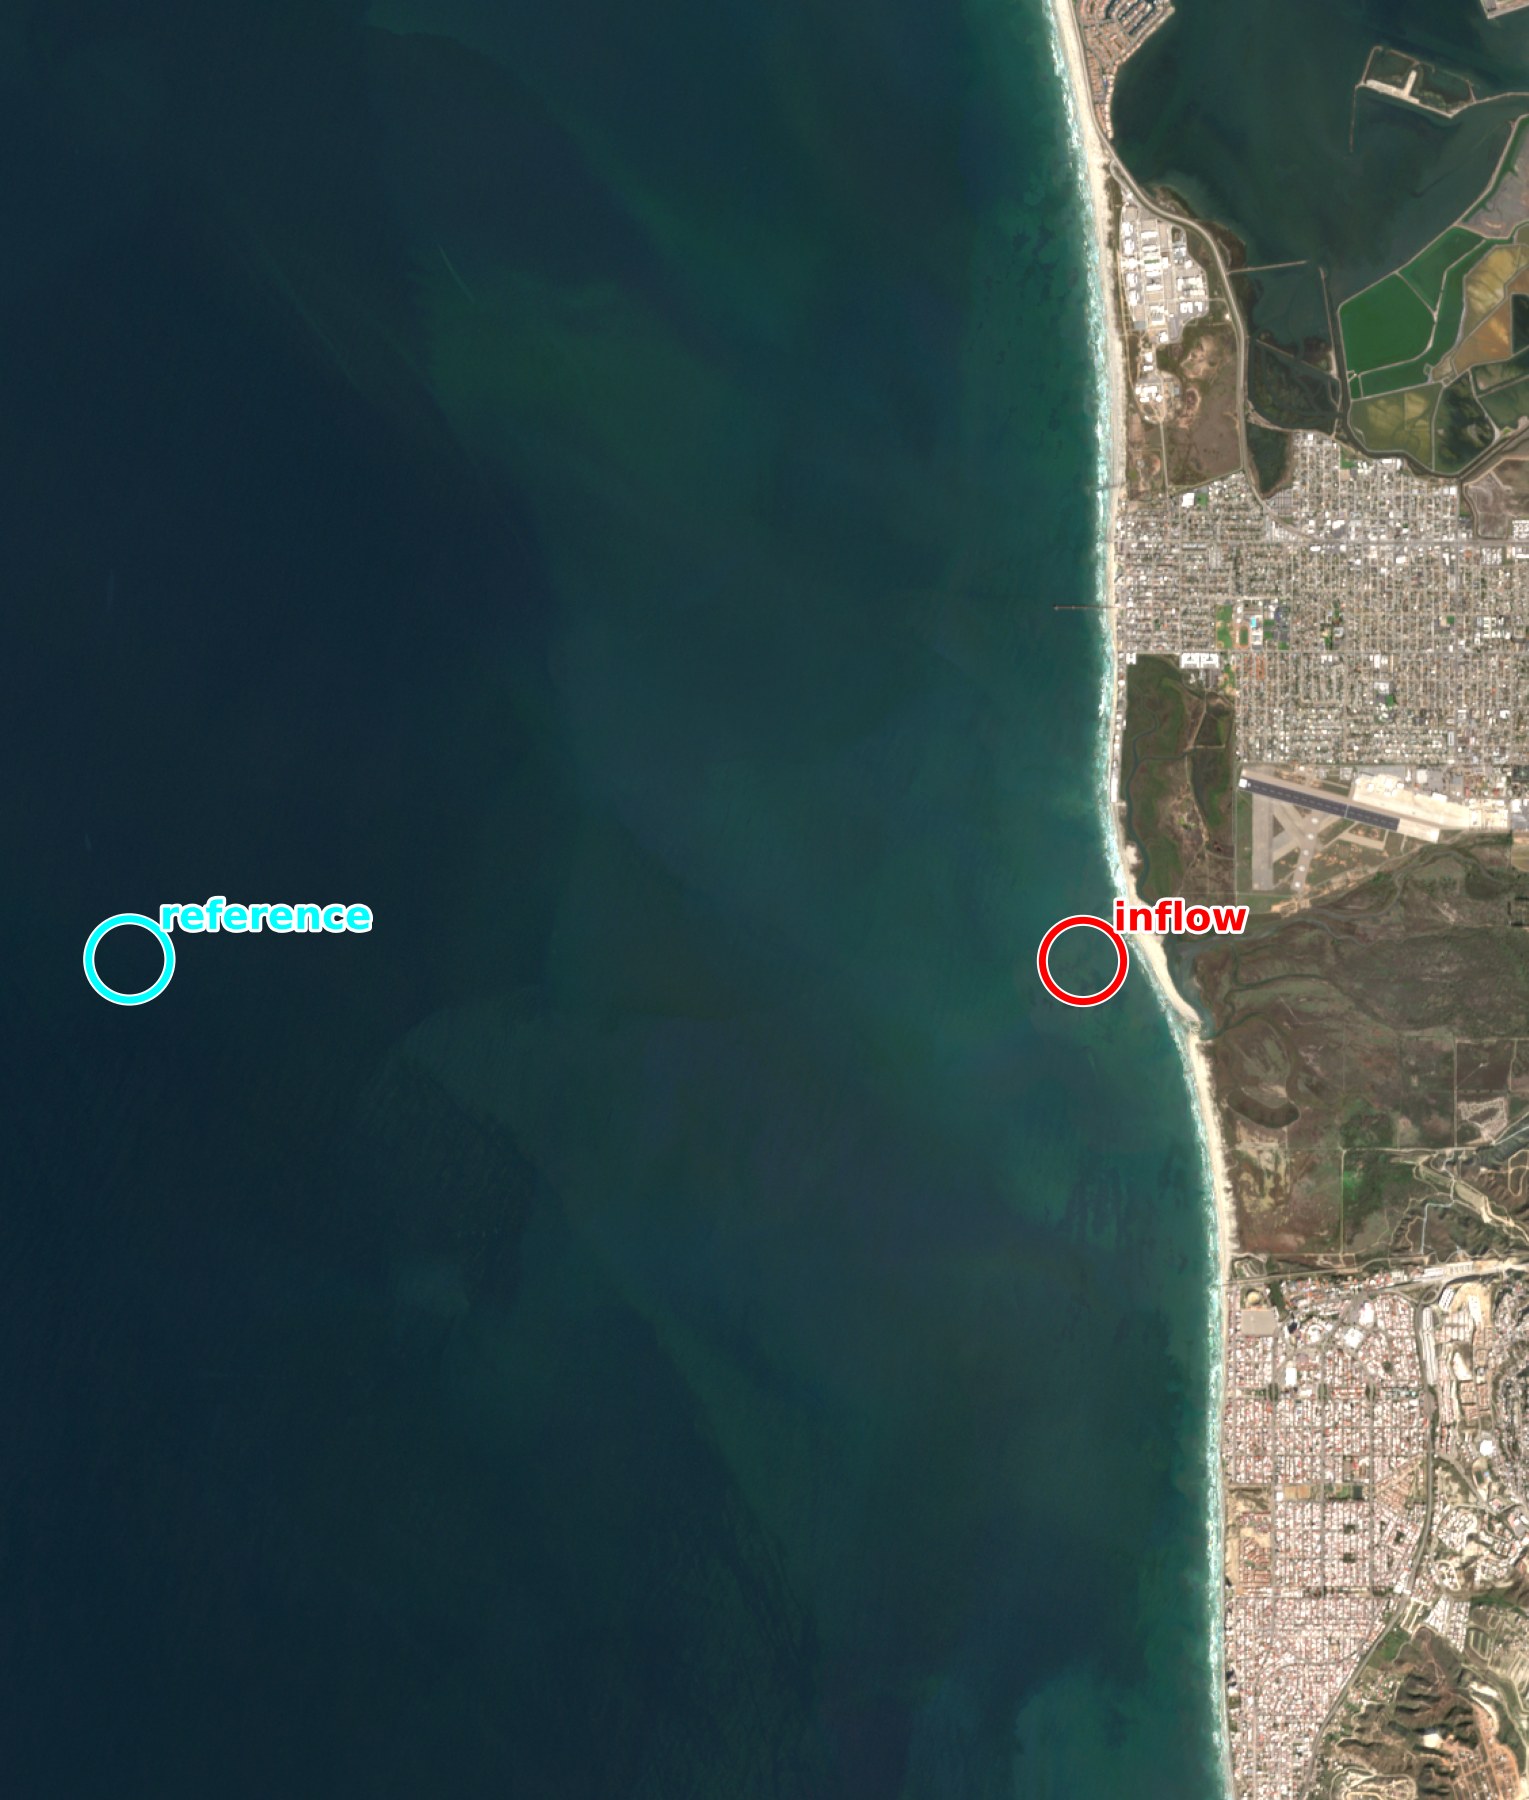
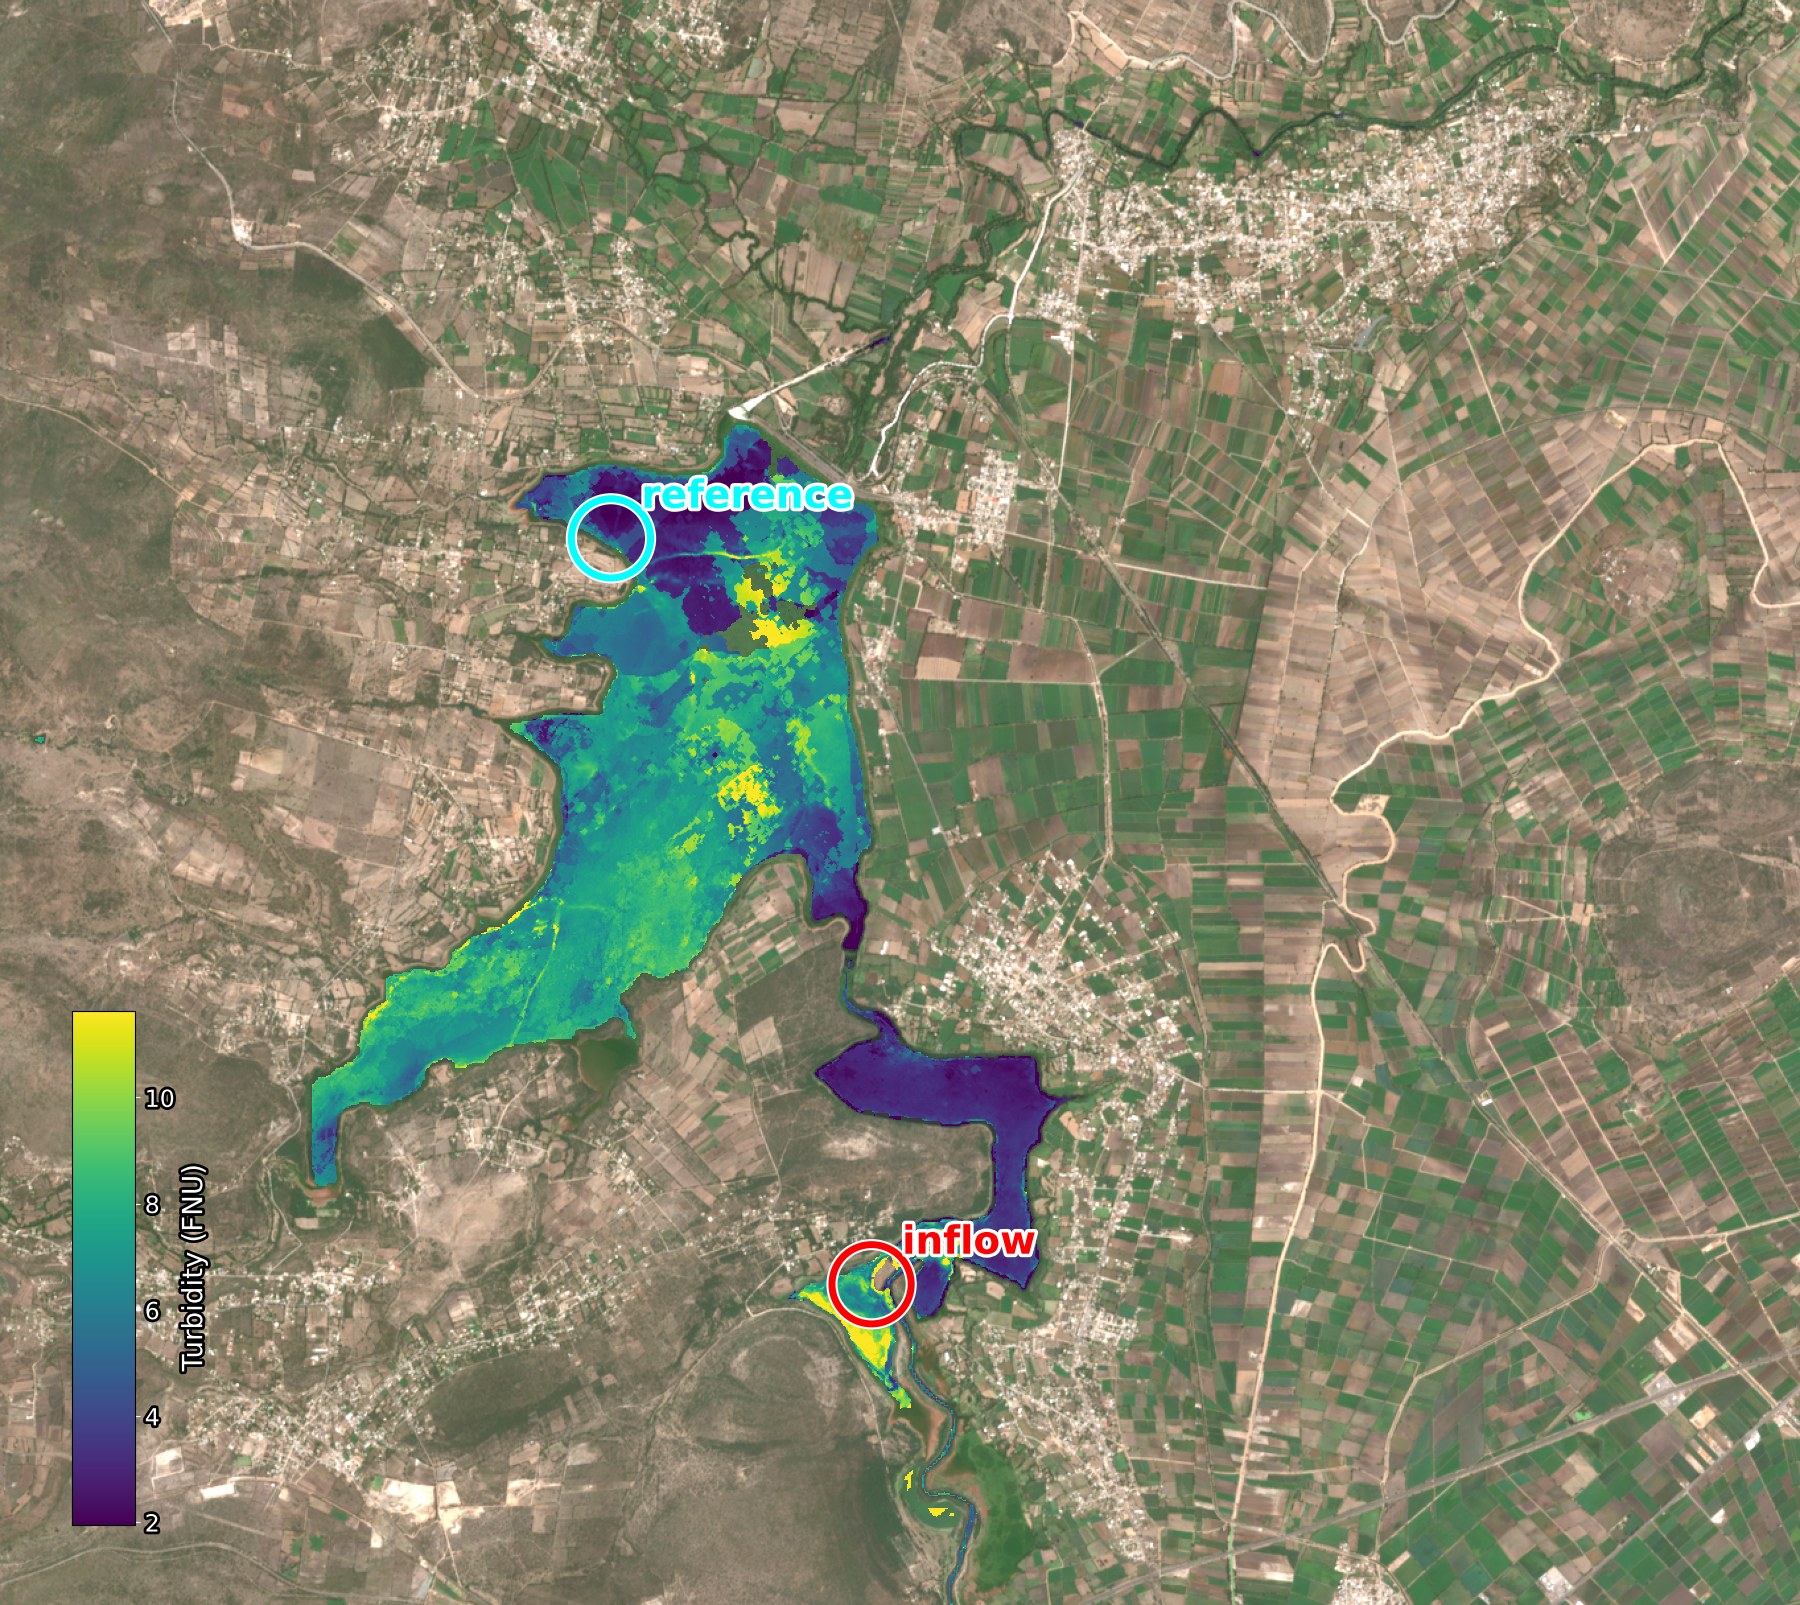
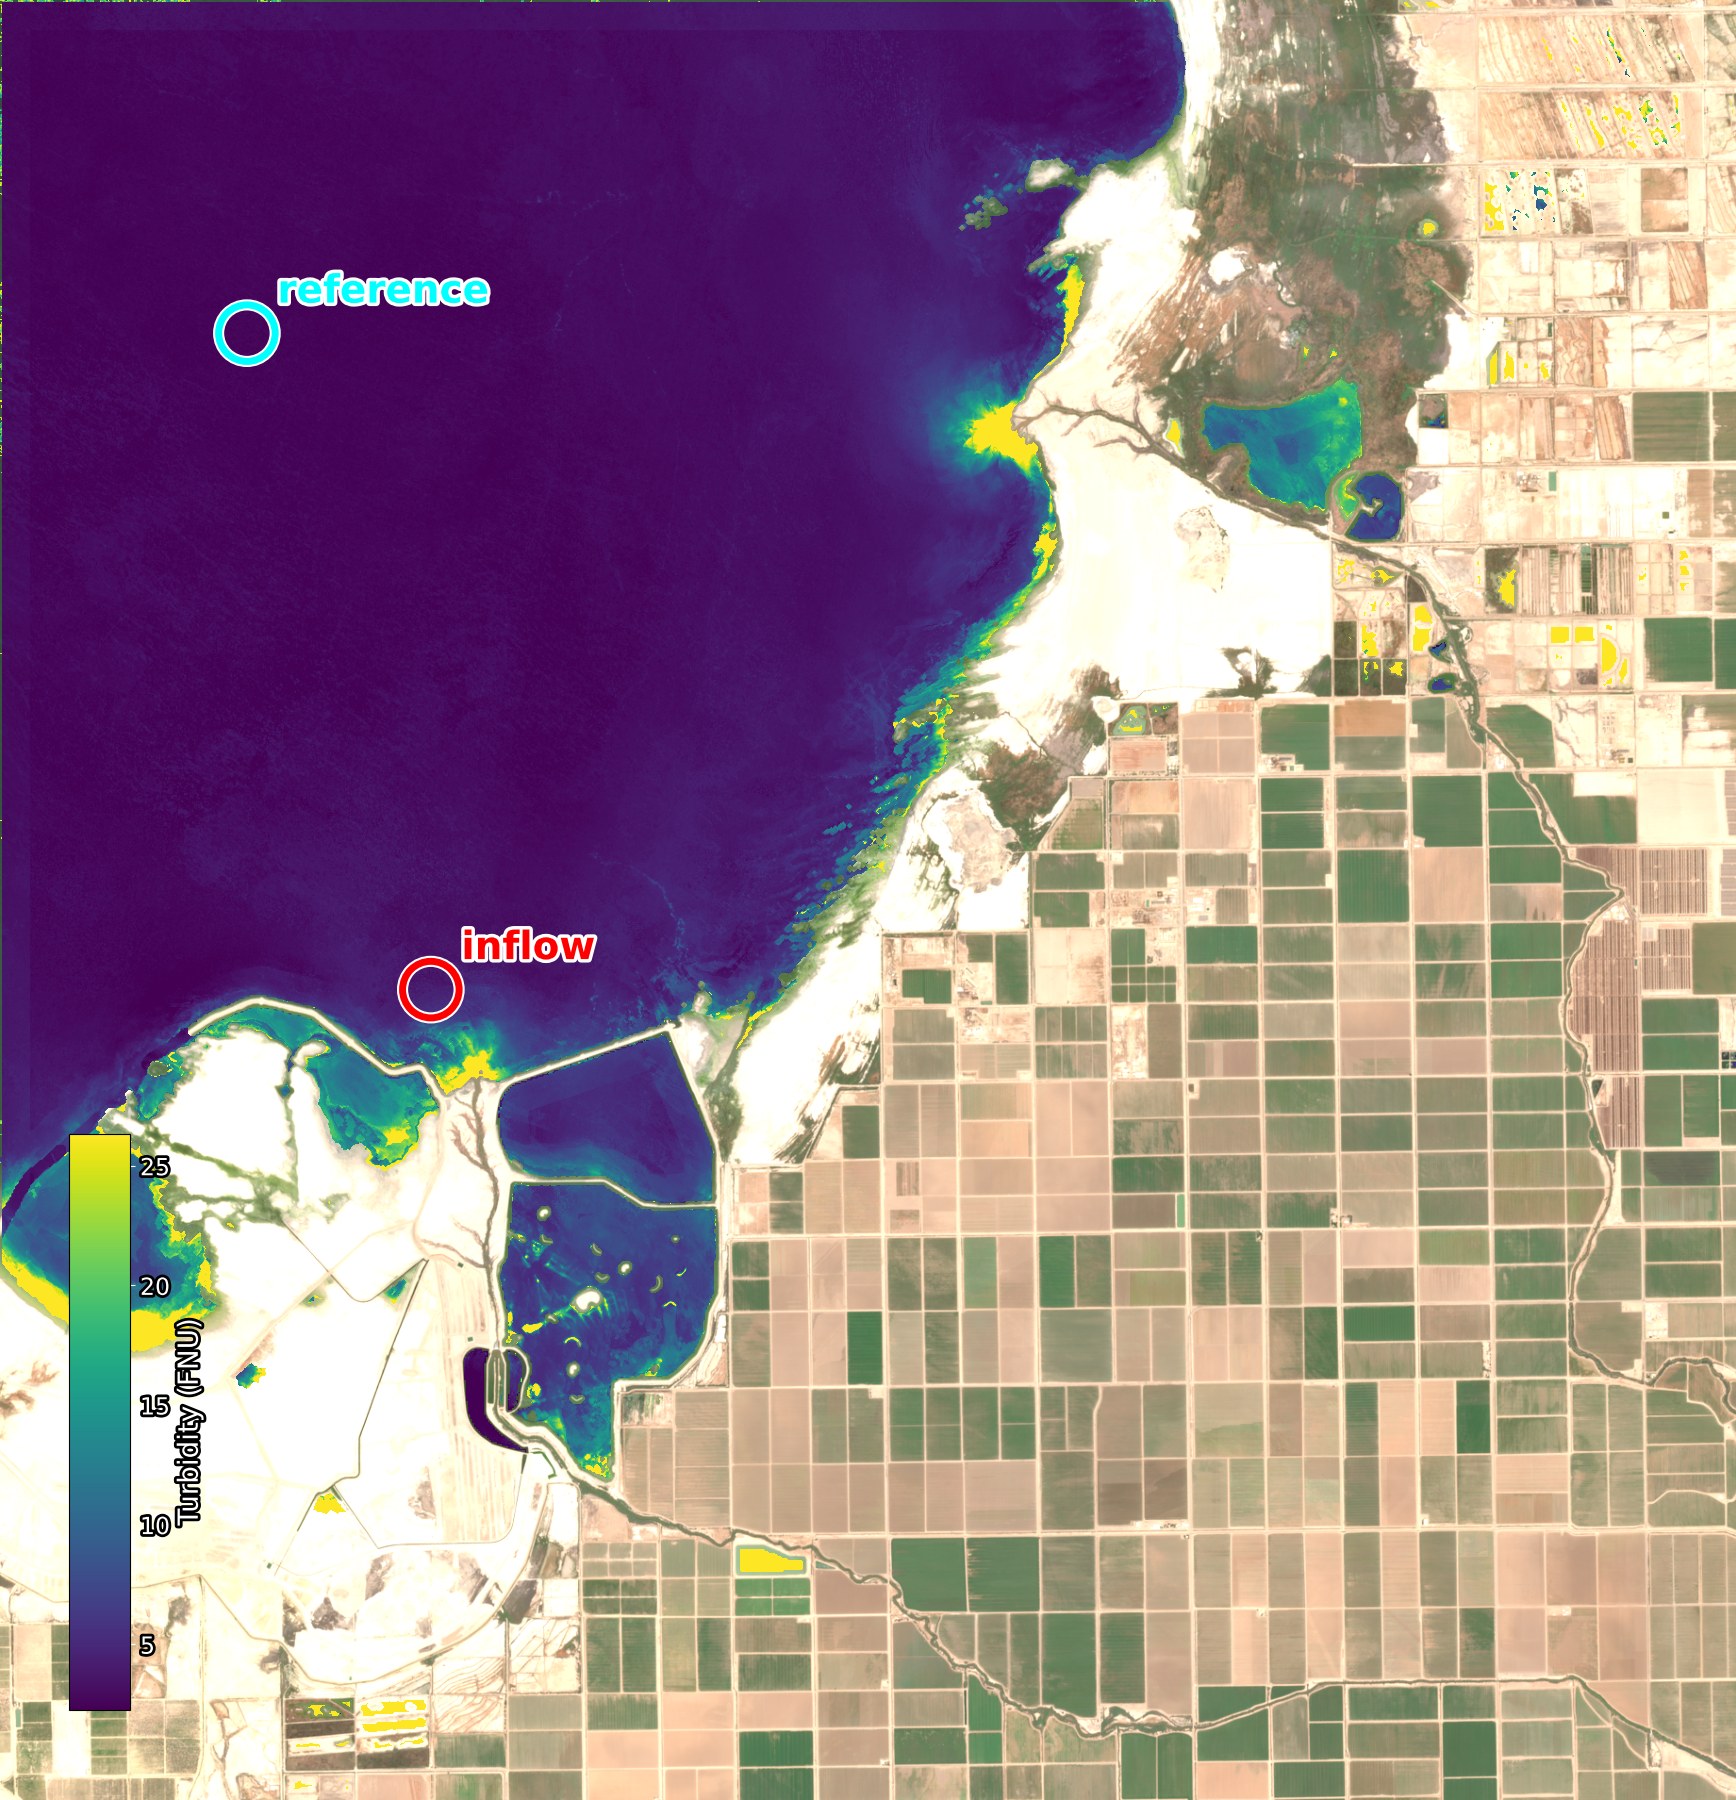
Maps where a wastewater outflow changes its receiving water. Give us the area, the outflow location and a reference location in the same water body.
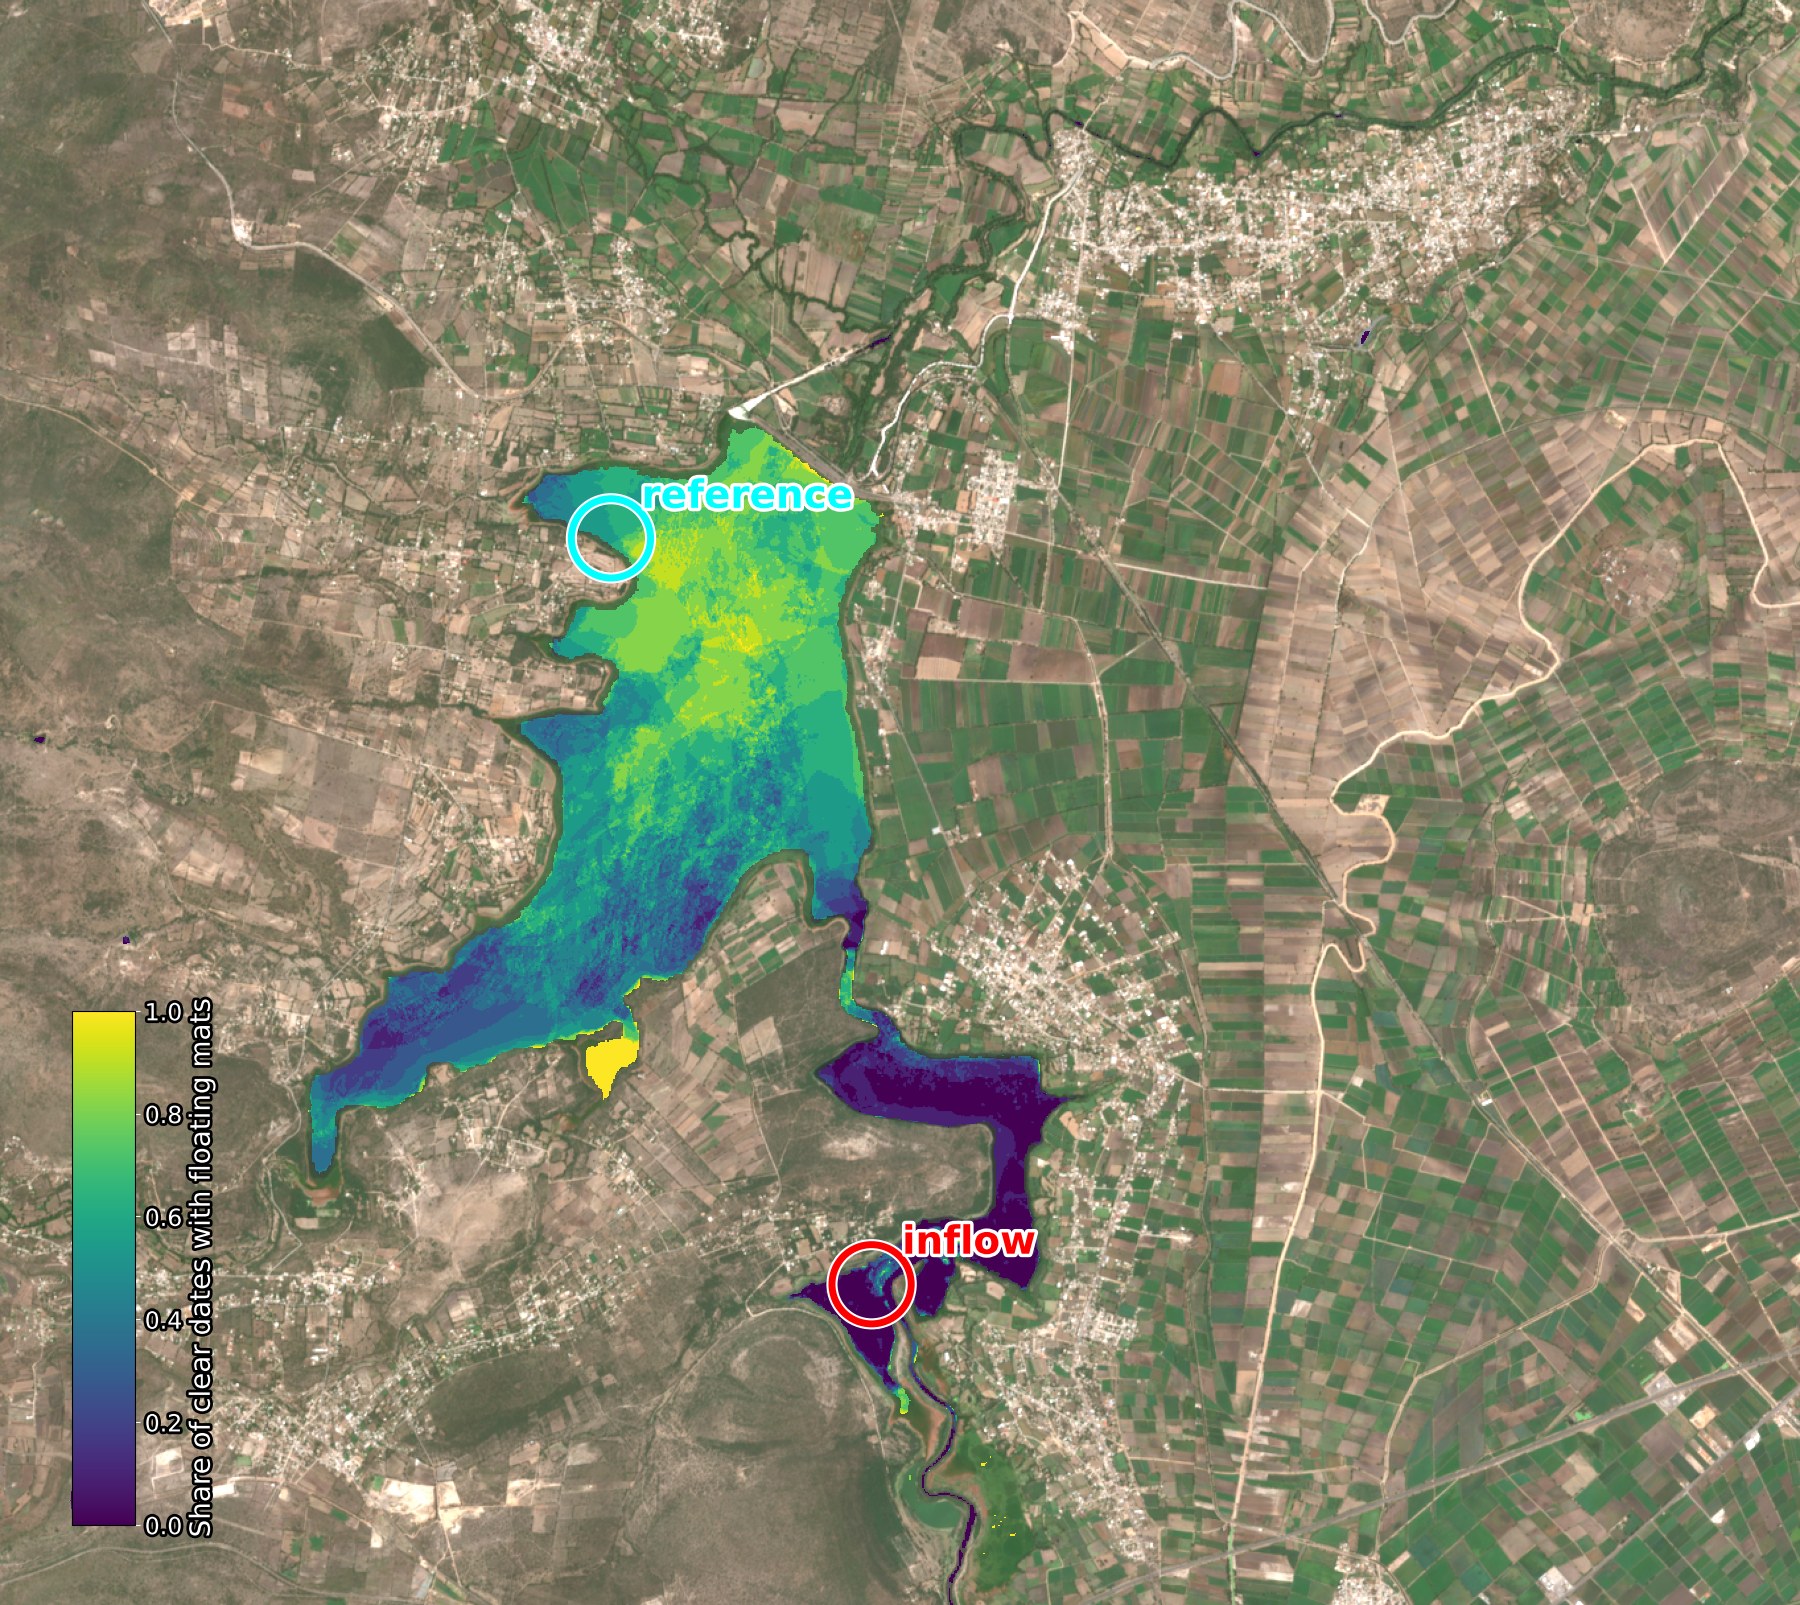
- Indicators: turbidity, chlorophyll-a, water colour (dissolved organic matter), floating mats (area, frequency), water temperature, cyanobacteria pigment (hyperspectral, optional)
- Every value is compared with the reference point in the same image (same sky, sun and sensor), so differences hold without calibration
- Consistency: share of dates on which the outflow area is worse than the reference
- Floating mats and algae are mapped separately and kept out of the water measurements
- Clouds and haze are dropped automatically; multi-date medians (up to 12 clear dates) or a chosen season
- ETD 2m enhanced imagery: sharper water outlines, about 20% more usable water area at ponds and shores, and water bodies narrower than 10m become mappable; 2m and native 10m values agree on lakes and ponds (correlation 0.97–0.99)
- Sources: Sentinel-2 (10m, every 5 days, since 2017), EMIT hyperspectral (60m), Landsat thermal
- Limits: absolute values within about 30–50% without water samples (a few samples on pass days calibrate them); channels under about 10m are not measured, and values on narrow rivers come from native 10m