Agriculture
Field anomalies, crop classes, field boundaries, soil moisture, salinity and grassland biomass.
Local agriculture spans a range of concerns, from food security to exports. EarthToDate provides several indexes and analytics supporting agriculture-related monitoring.
Field Anomaly Detection Coming soon
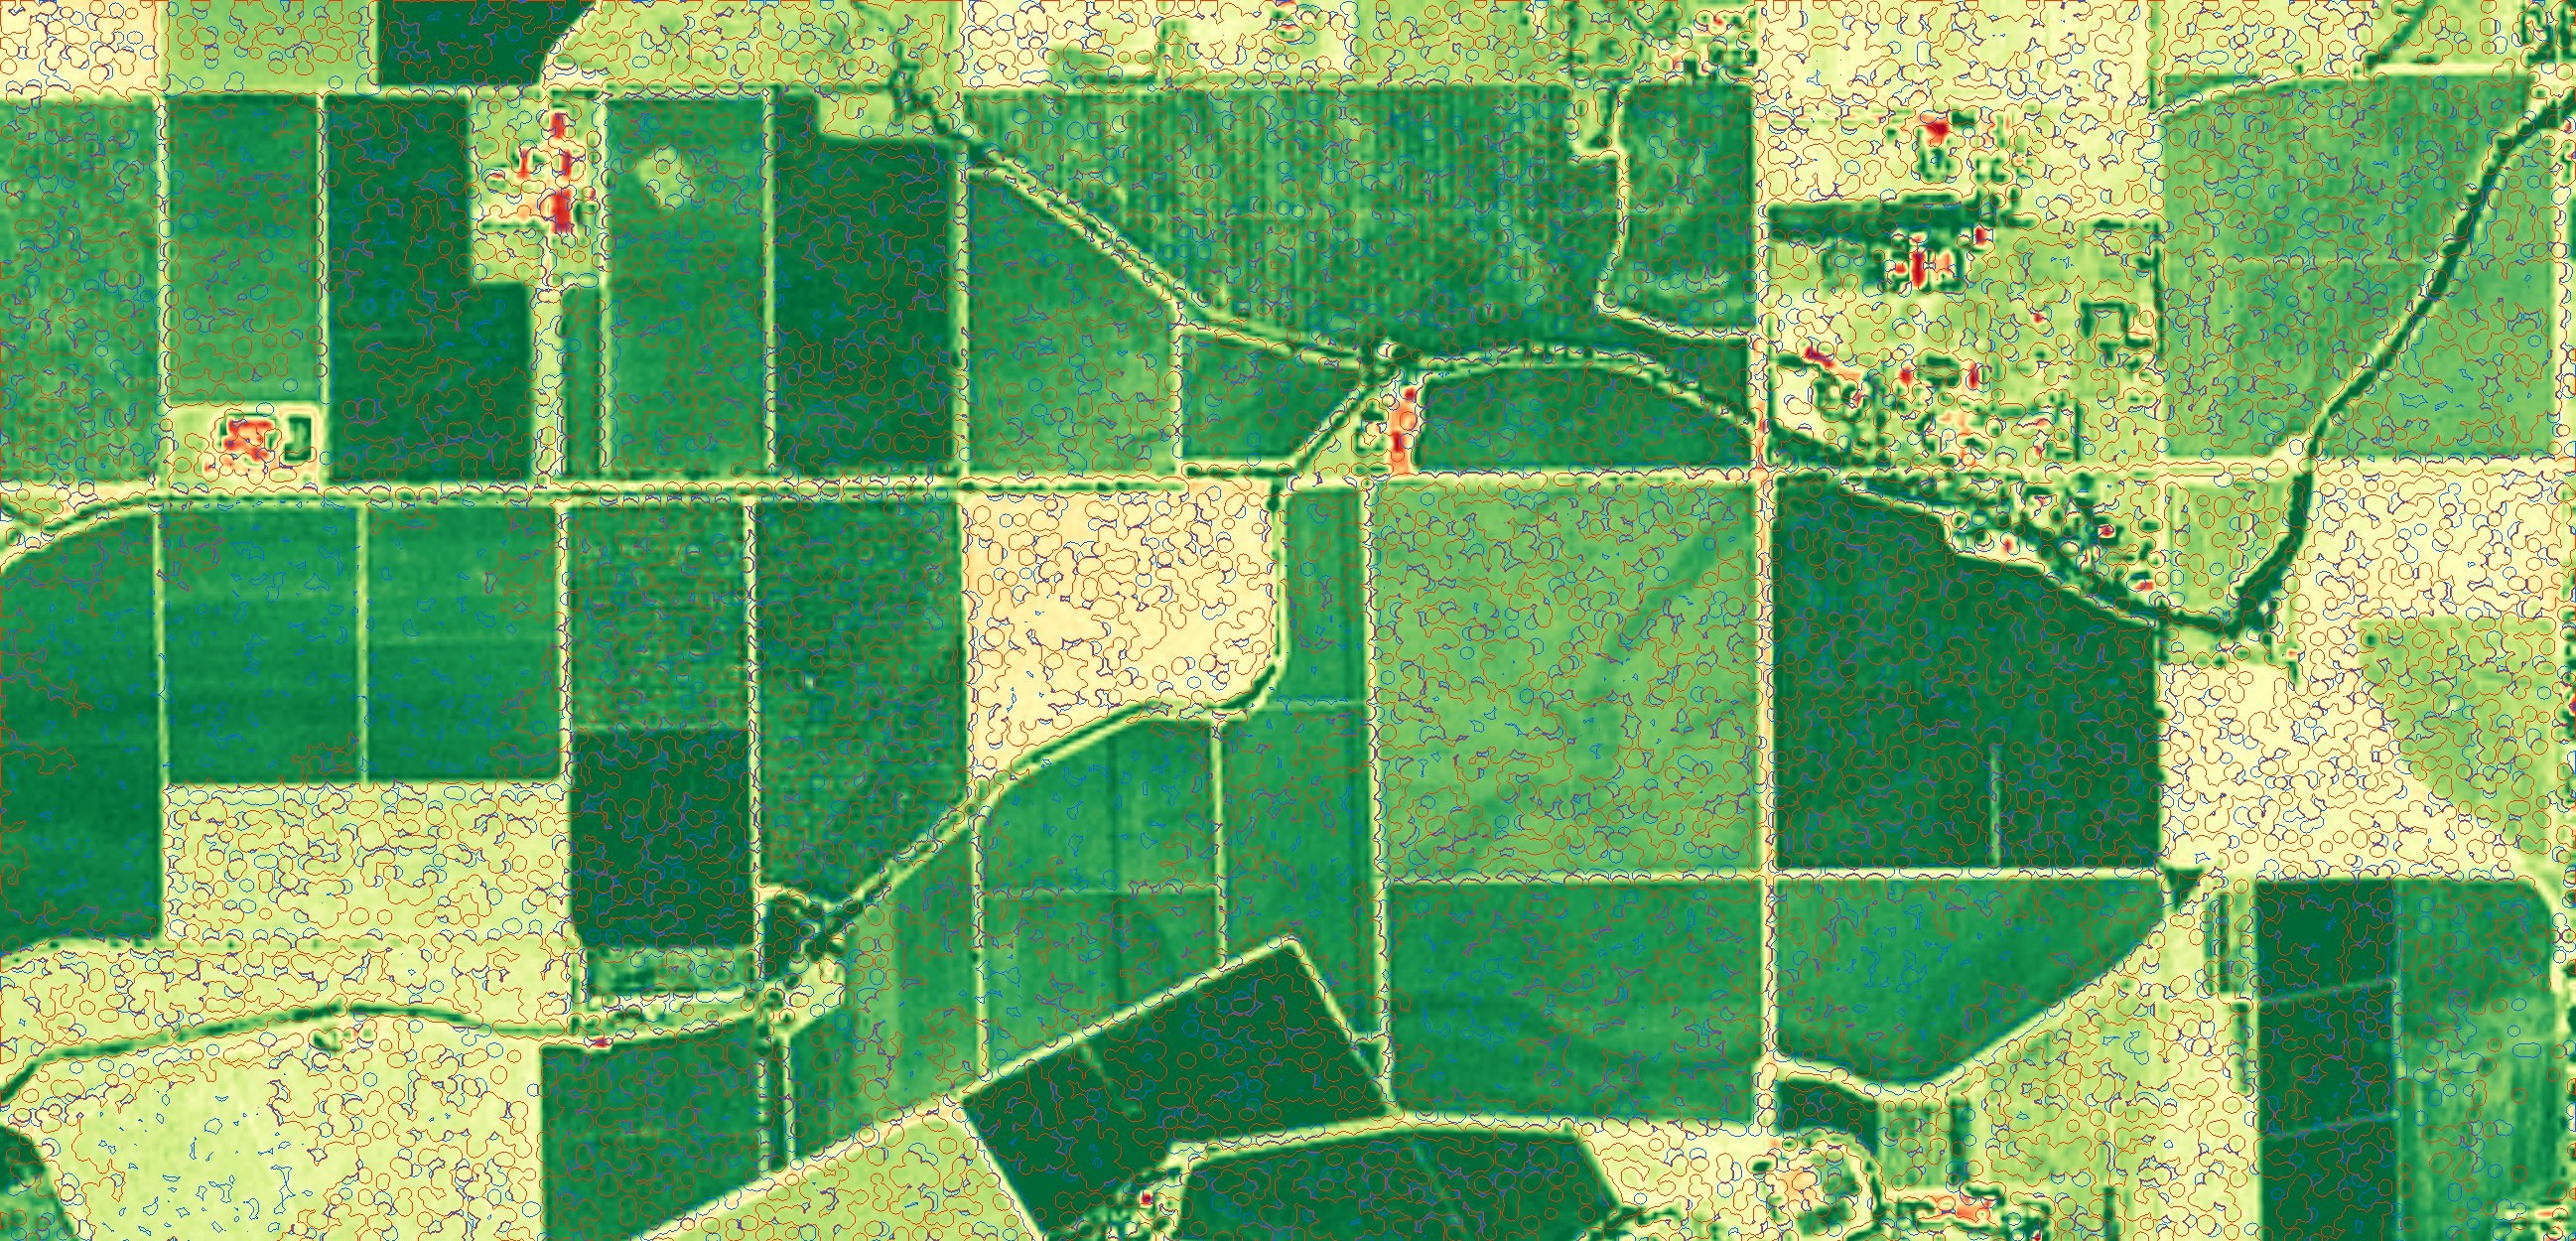
From government agencies to industrial agriculture growers, all large-scale agriculture operators have one universal need over the growing season — knowing as early as possible where something is potentially an issue in their fields and determining if and how to handle it. Over large areas, often distributed through an even larger region, this becomes a challenge in terms of cost and complexity.
Such issues include:
- Weeds
- Disease outbreak
- Pest outbreak
- Fire
- Physical impact (such as natural or human unplanned activity in the field)
EarthToDate Field Anomaly Detection is uniquely suitable for the job. Employing frequently updating large-scale satellite imagery, it tracks the vegetation progression in the field in the way unique to each field and period, marking spots developing an unexpected change of higher or lower growth. Spots are detected down to 4×4m from 2m data, with thresholds set automatically per field, season and image pair.
Crop Classification Coming soon
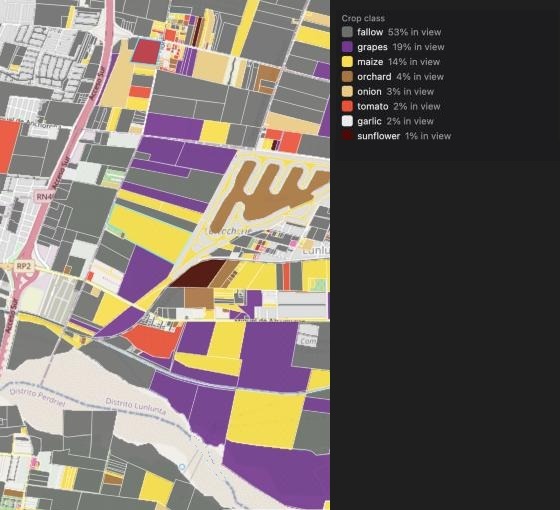
Different parties are interested in identifying crop types cultivated, past and especially presently, usually over large areas up to entire countries. About 150 crop species are grown at scale for food and feed, out of some 7,000 plant species ever cultivated, and each comes in many varieties; the best practice at full scale is really self-reporting by growers, if at all, with the resulting delays and inaccuracies.
EarthToDate employs complex agronomical heuristics to identify crops at scale from satellite imagery. The intelligence can be applied as-is over any geographic location, or be fine-tuned to a geography if ground truth is available for a past period.
Field Boundaries Coming soon
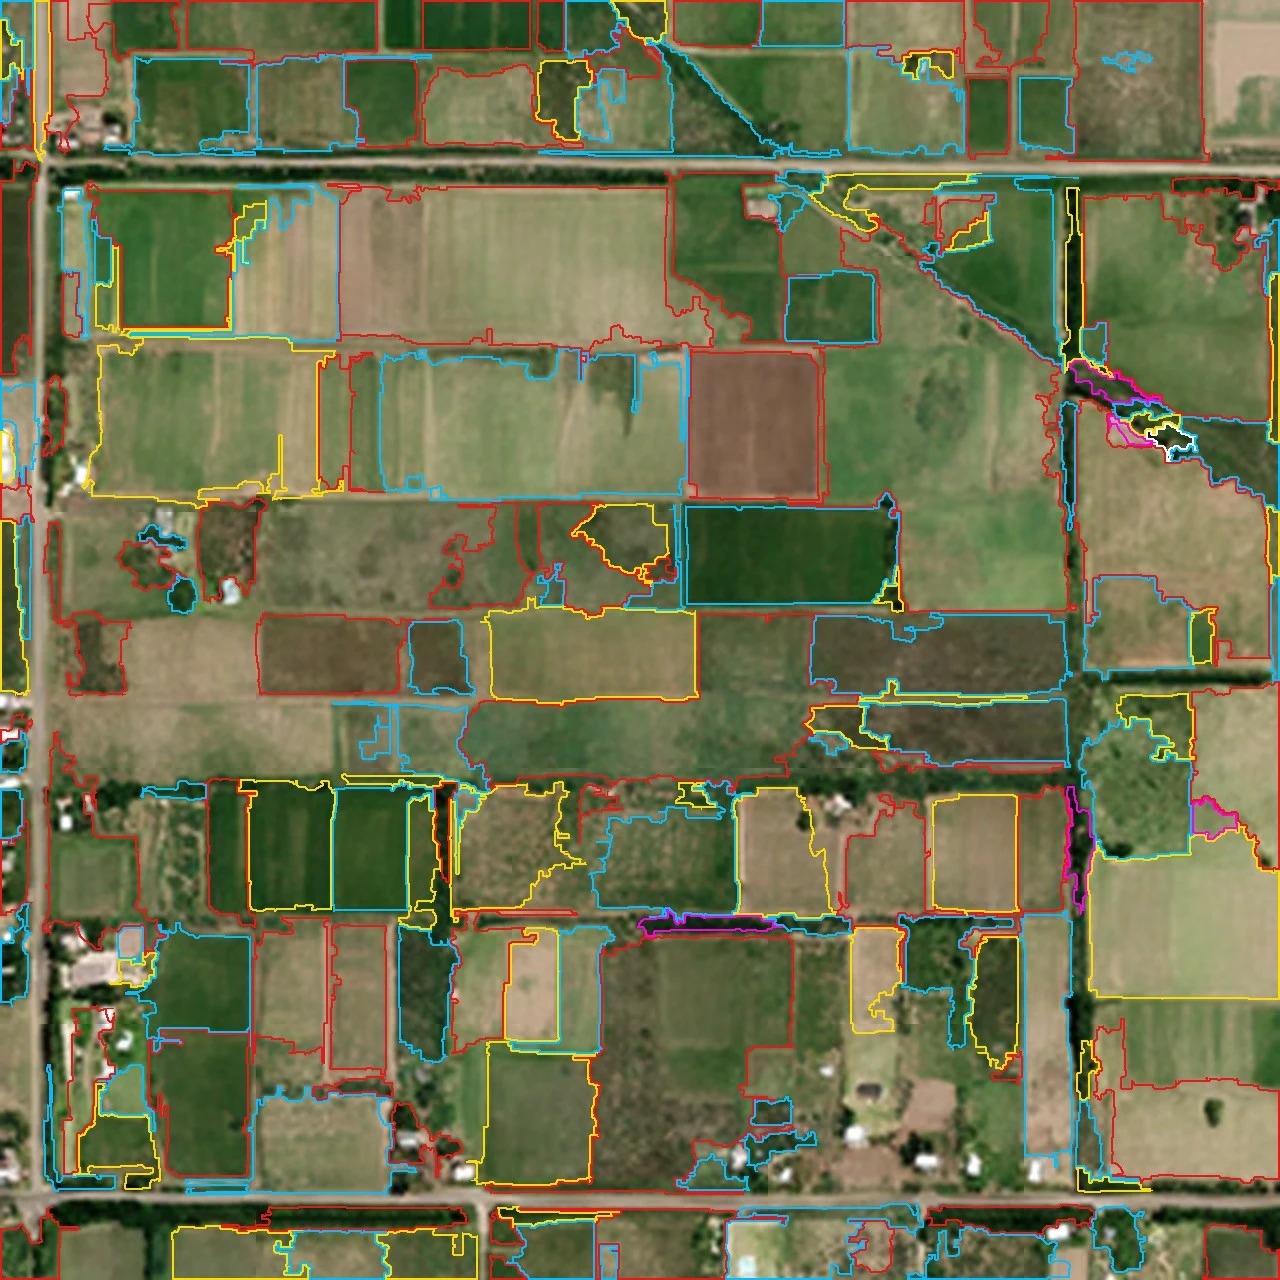
Field boundaries change often in many situations, with fields divided and merged, part of crop rotation, ownership change and other conditions. With such frequent changes, it is difficult for relevant stakeholders such as government agencies and large-scale commercial operators to track the changes reliably and continuously. Several global efforts are available, such as Fields of The World, but at very limited frequency and accuracy.
EarthToDate field boundaries provides the equivalent of expert human inspection, identifying actual fields on the ground at any given time.
Soil Moisture
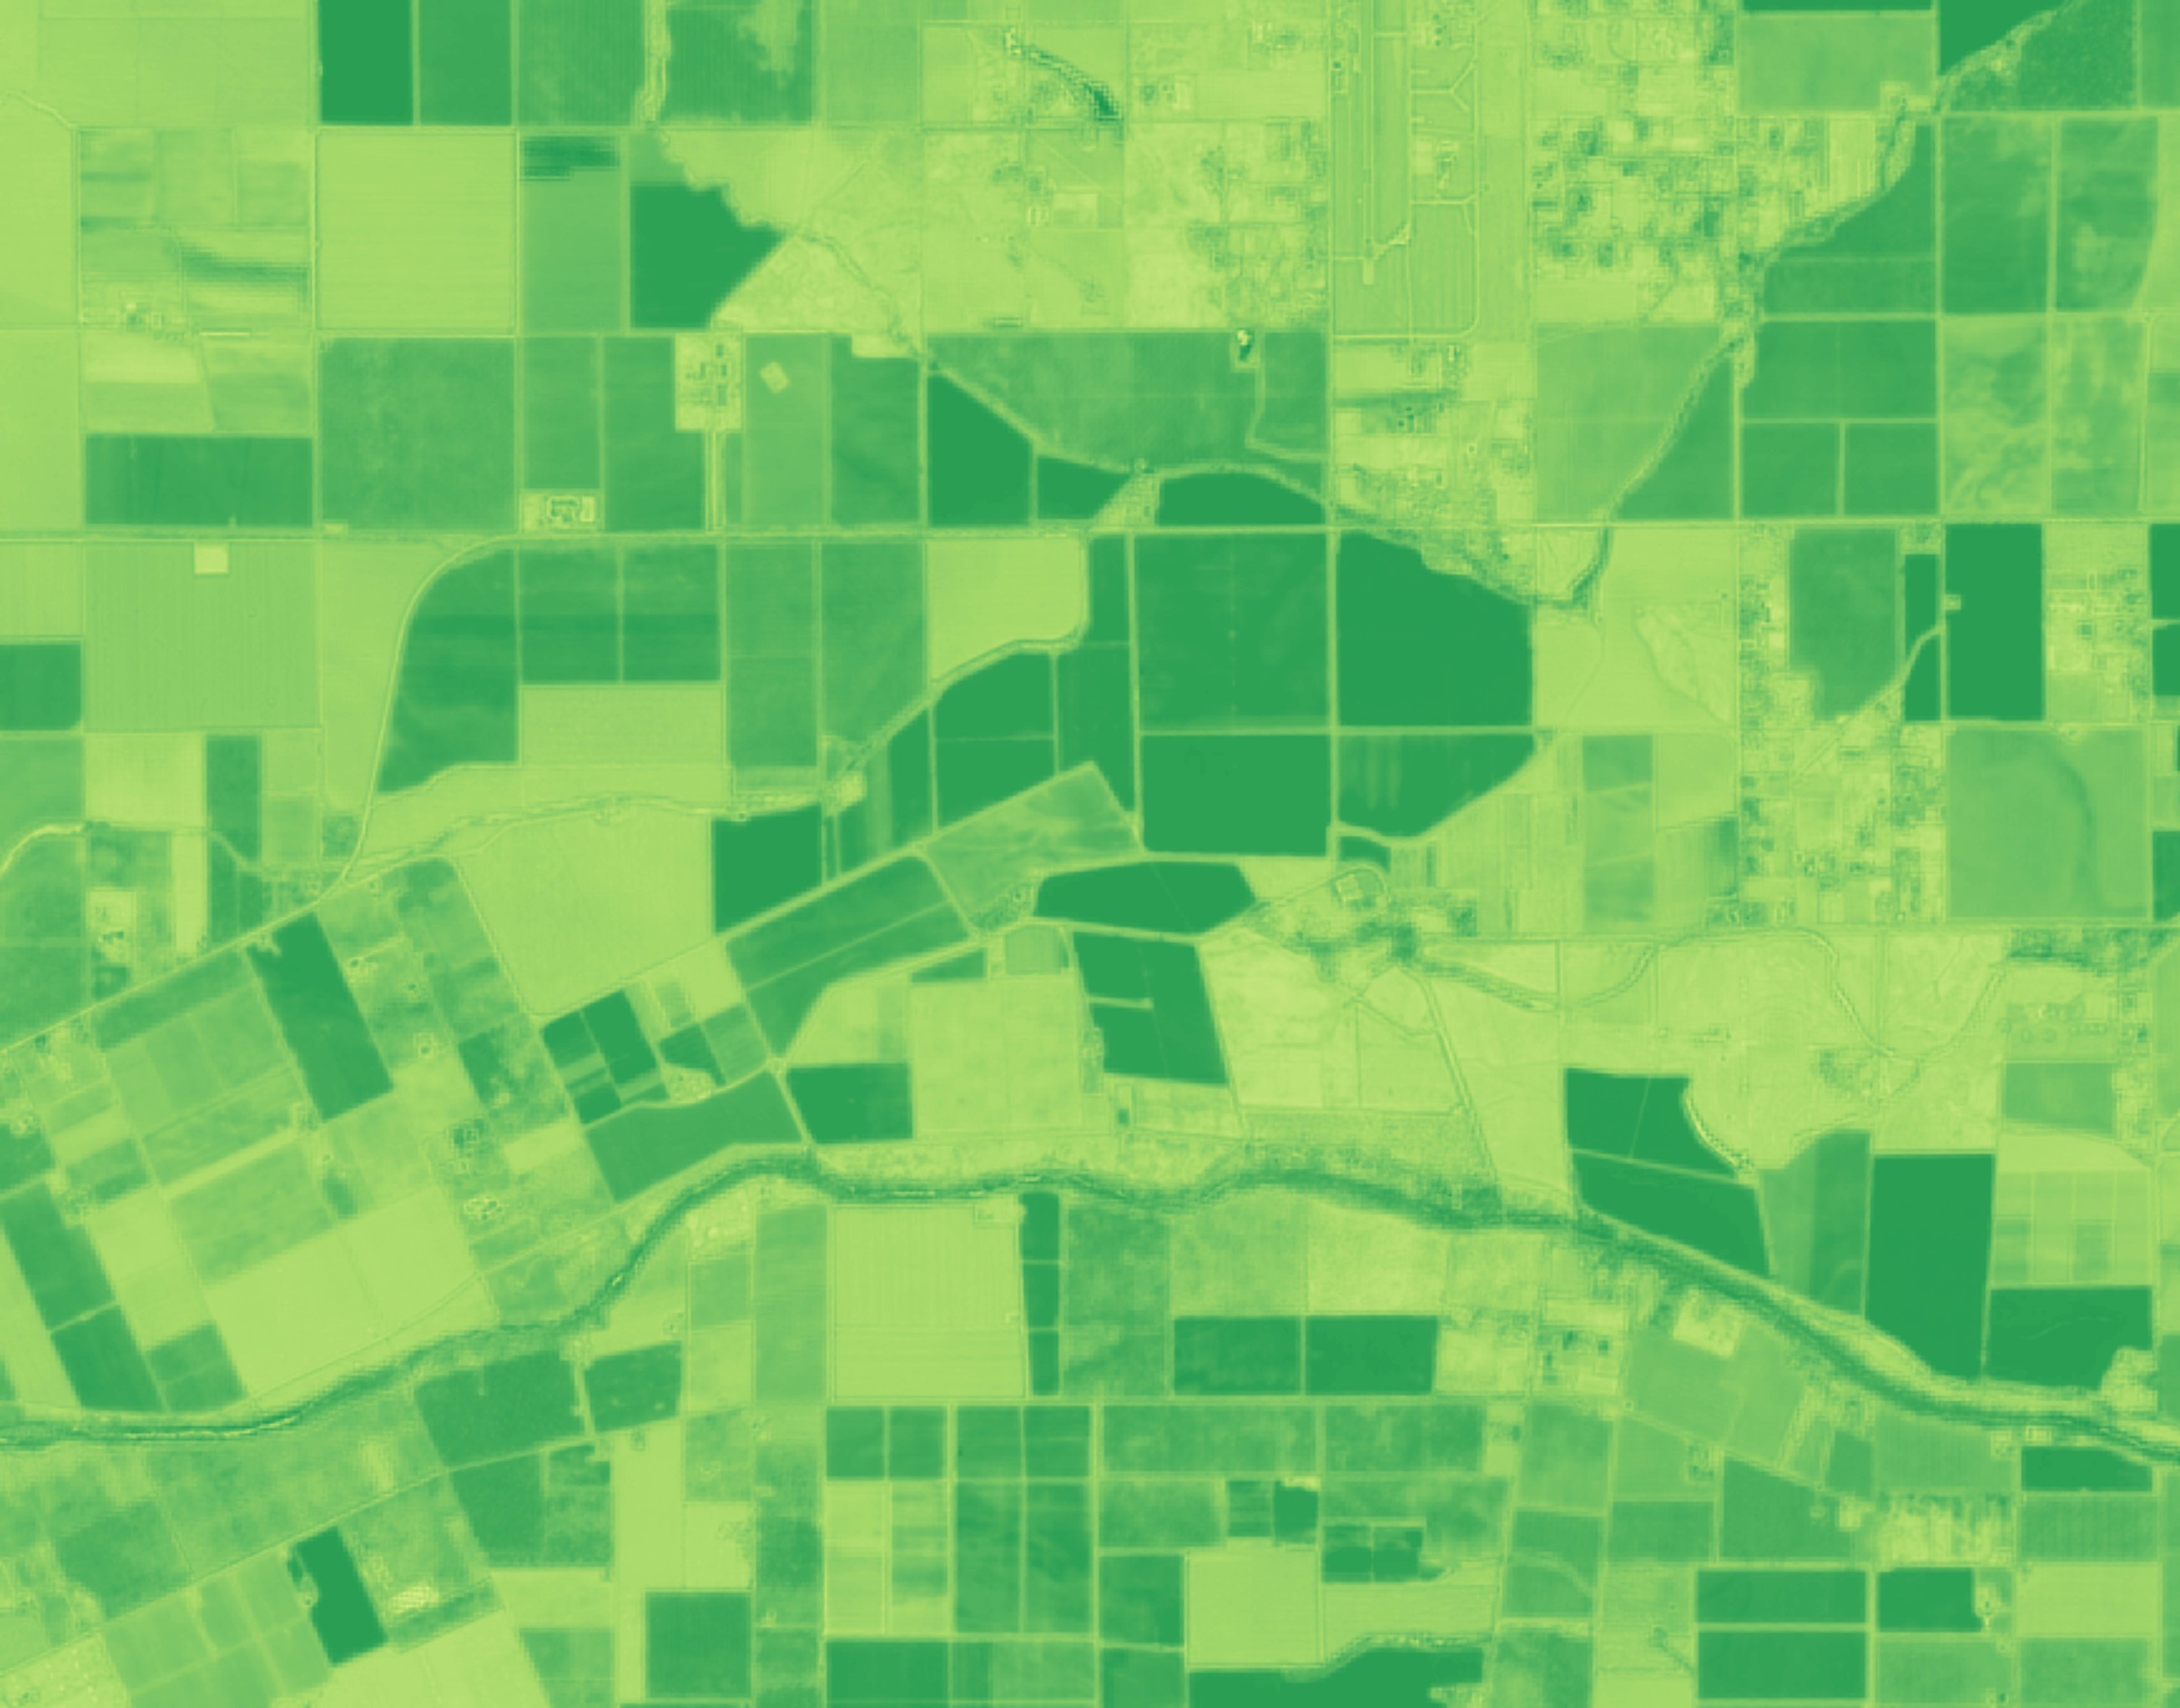
There are many different uses and needs requiring reading soil moisture. Deploying a large number of physical sensors is expensive, complicated, and at some regions and scales impractical. Knowing soil moisture then supports irrigation planning, yield prediction and other valuable needs. Soil moisture is also an input to drought monitoring, flood and landslide risk, trafficability for heavy vehicles and wildfire risk.
Remote sensing includes well-known options such as the NDMI index, but from wide area satellite imagery sources it's usually coarse at 10m to 30m per pixel, resulting in late or only average readings.
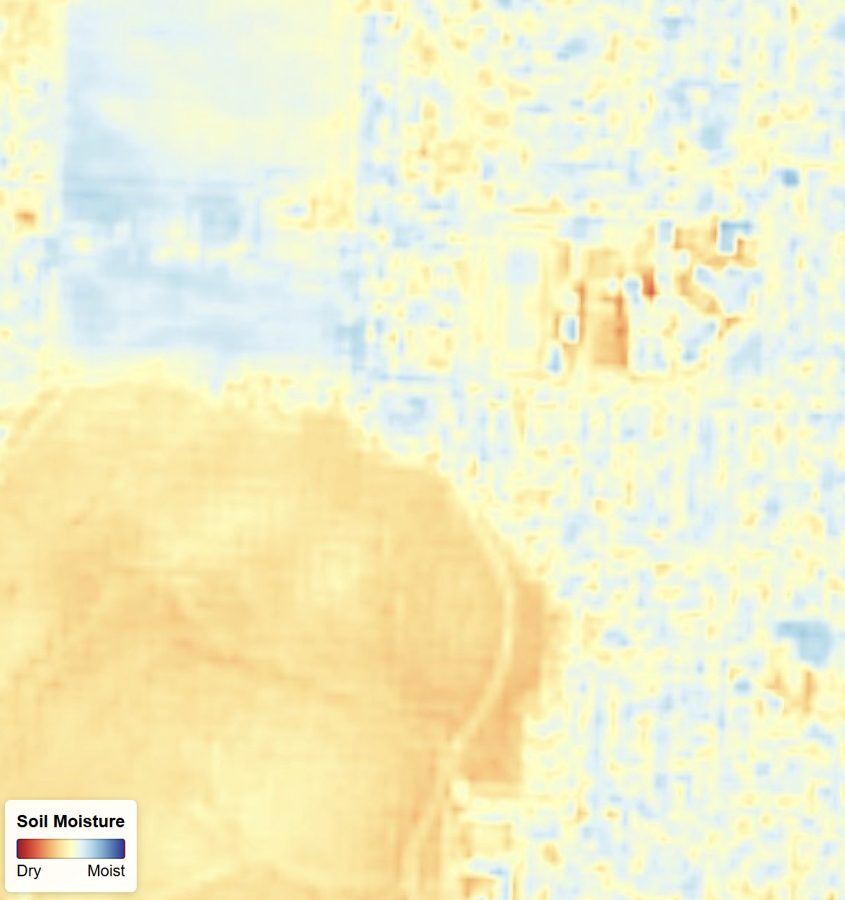
EarthToDate soil moisture index integrates multiple accepted methods beyond a single index, balancing for higher reliability in various geographies, conditions and terrains. At 2m GSD the measurement supports more detailed data for earlier detection and action planning.
Salinity
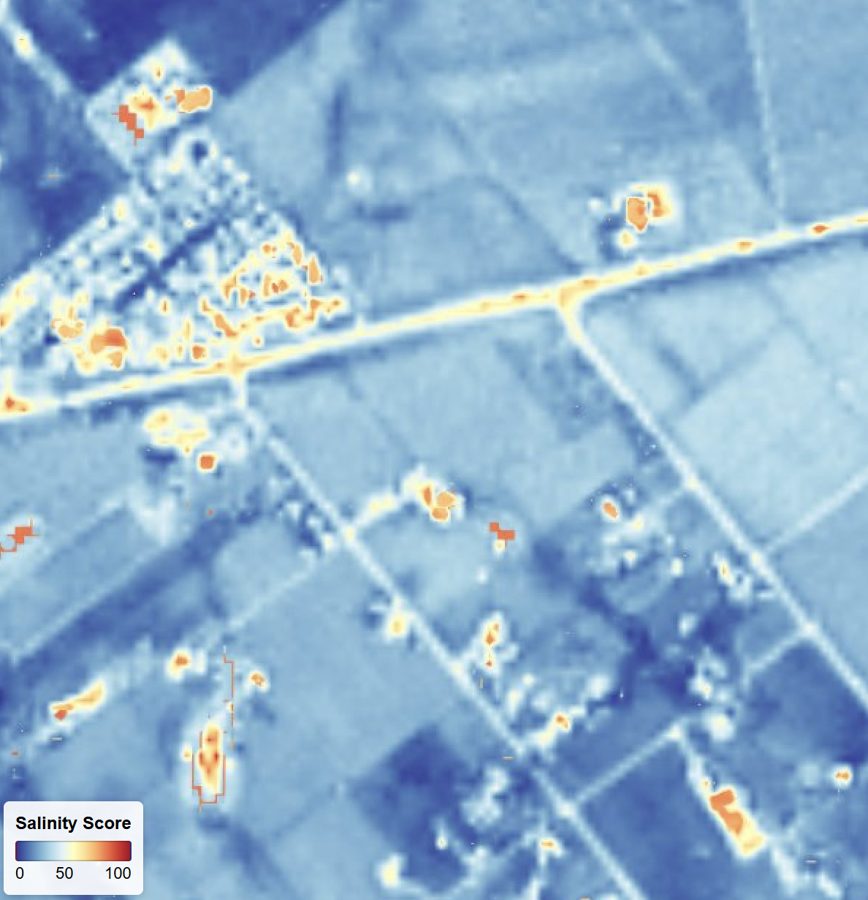
Ground salinity is a growing concern in many geographies. It is also more present under specific conditions, such as along irrigation lines. Early detection is obviously crucial, as by the time it can be detected in tens of meters resolution it's likely already catastrophic in nature.
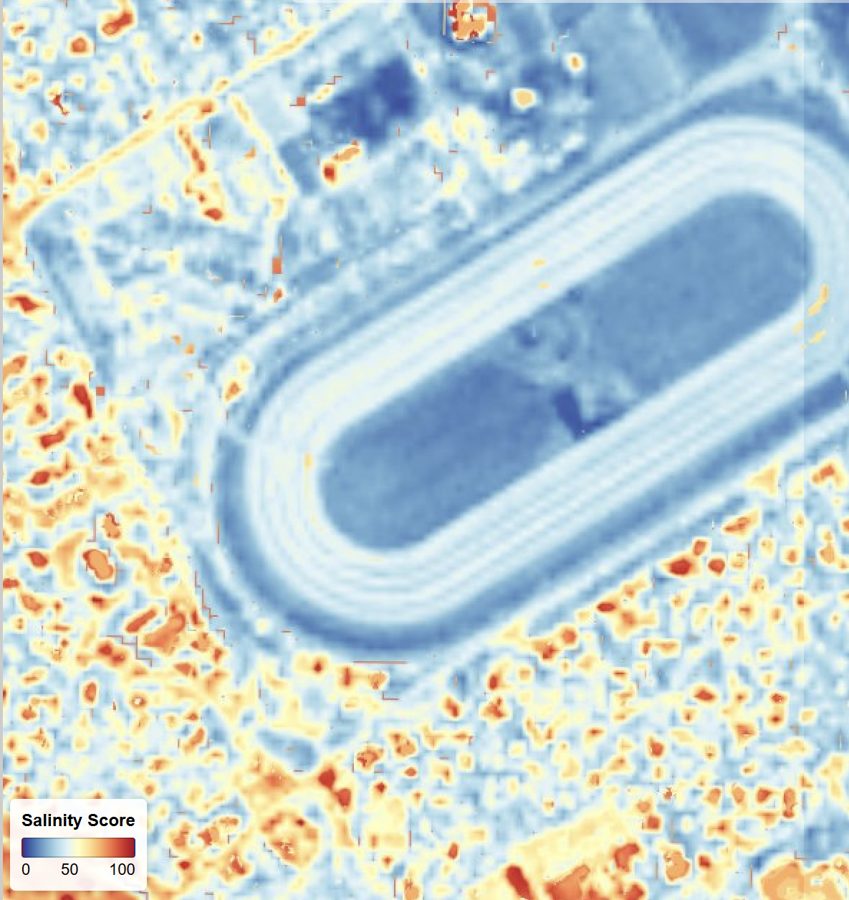
EarthToDate salinity monitoring integrates multiple published academic research papers into one global index, available as a 0–100 score, five classes (non-saline, slight, moderate, severe, extreme) and a 0–100 confidence level of the reading. This allows relevant stakeholders such as government agencies and commercial operators to monitor and respond as this issue develops. At 2m GSD the data supports early detection of the condition.
Grassland Biomass
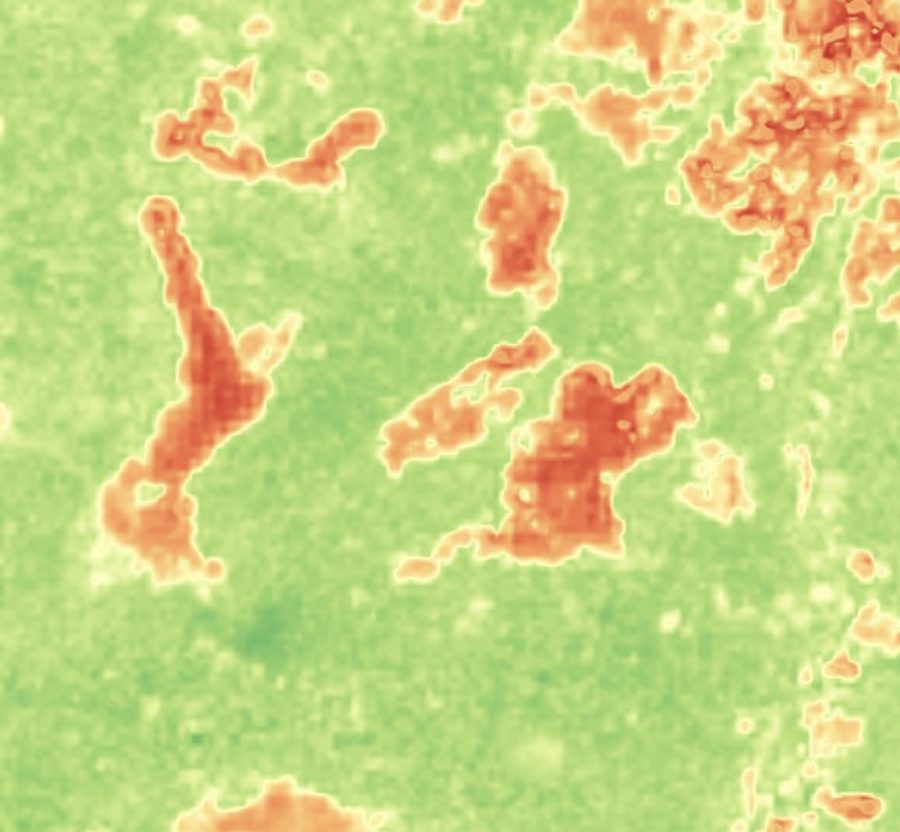
Grazing animals feeding means a continuous management of determining when potential feeding is being exhausted in one field and the animals need to be moved to another. The question is which one, and the answer is based on parameters such as distance but also, to a large extent, where the animals have more to eat. This is based on each field's biomass, which cannot be easily judged by inspection or growth indexes like NDVI.
Of course, some needs like government or commercial management of grassland biomass have their own value, such as carbon credits and environment health tracking.
EarthToDate Grassland Biomass integrates multiple published academic research papers into one global grassland biomass index, making it easy for users to use without any complex local adjustment. Biomass is reported in t/ha. Absolute measurement is within reasonable margins of error, but relative measurements are very reliable (±15–20%), ranking fields correctly more than 90% of the time, which is compatible with actual grazing animals management needs.
Plantation & Orchard Inventory
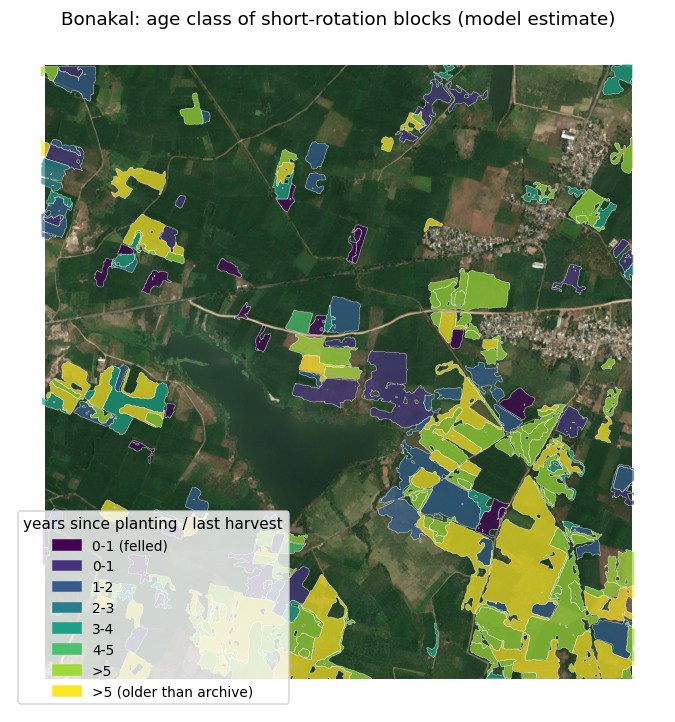
Custom solution, adapted per project (species, region, age classes, reporting units, yield model). Contact us to scope a pilot.
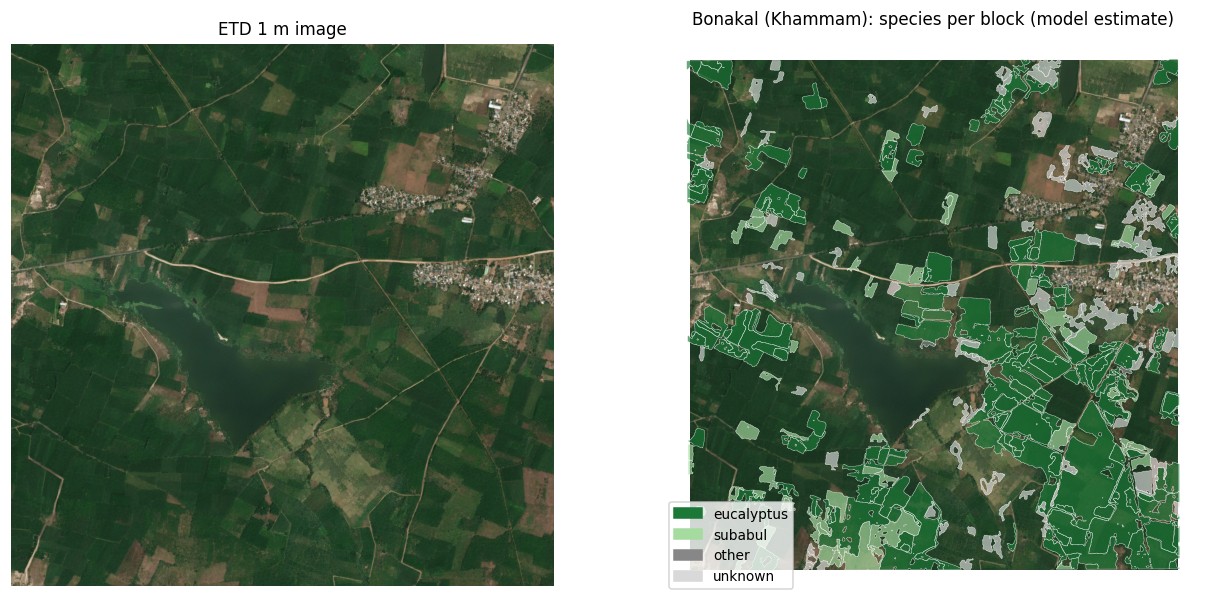
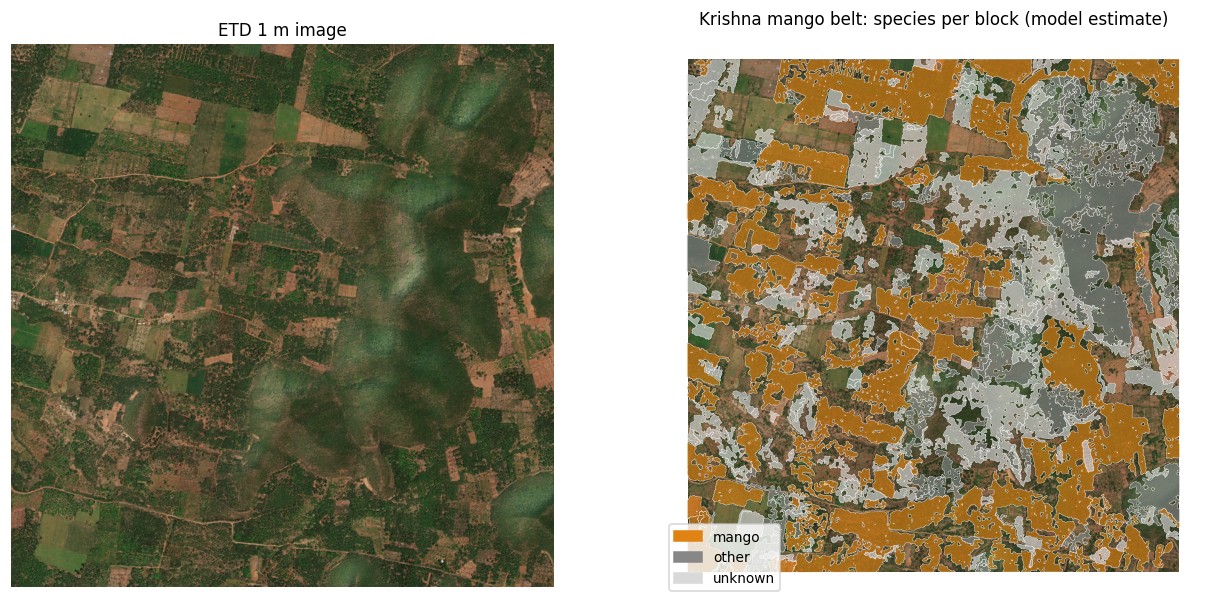
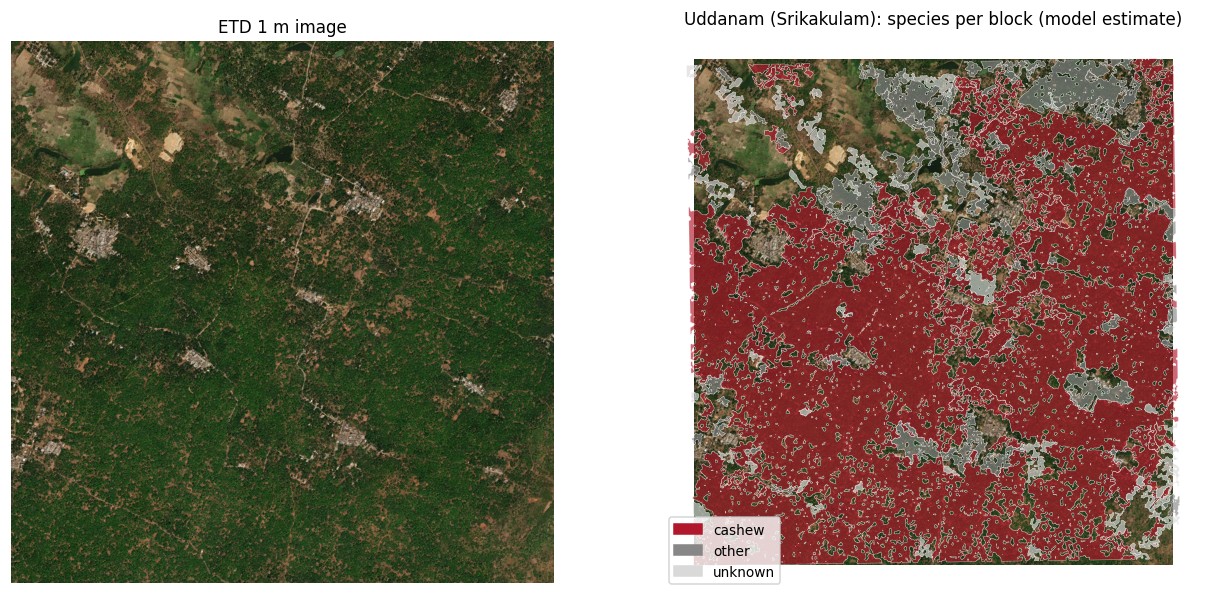
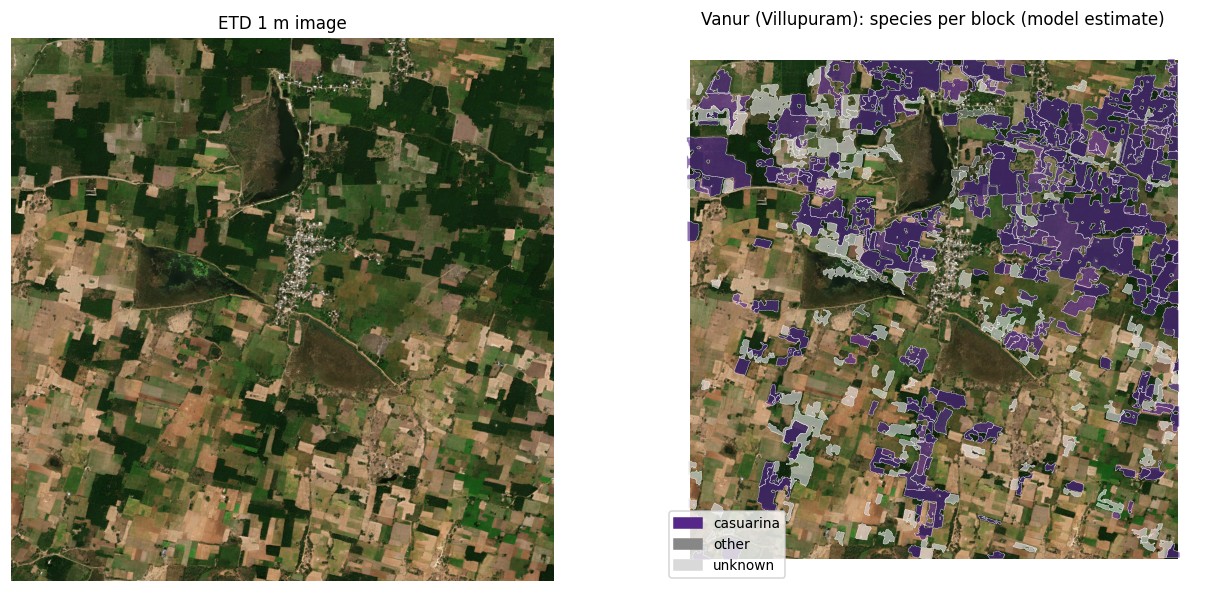
Block-level inventory of planted trees on farm land, mapped from ETD enhanced satellite data across whole districts or regions, with a multi-year wood-supply forecast.
- Species per block, down to about 0.2 ha (e.g. eucalyptus, casuarina, subabul, mango, cashew, oil palm, coconut), with an explicit "unknown/mixed" class instead of forced guesses
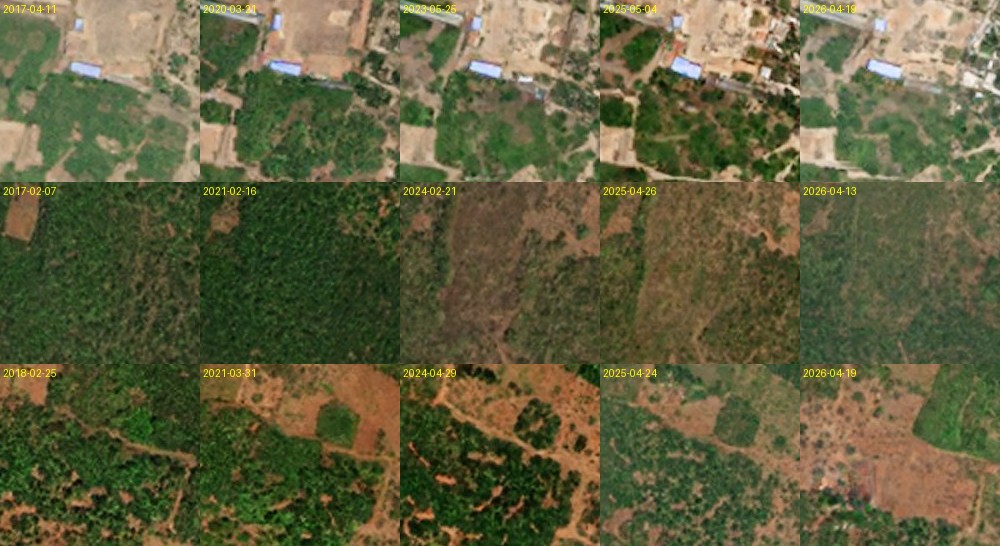
- Planting or last-harvest year from a 10-year satellite record; coppice treated as a new rotation
- Change flags: clear-felled in the last 12 months; orchard decline or removal
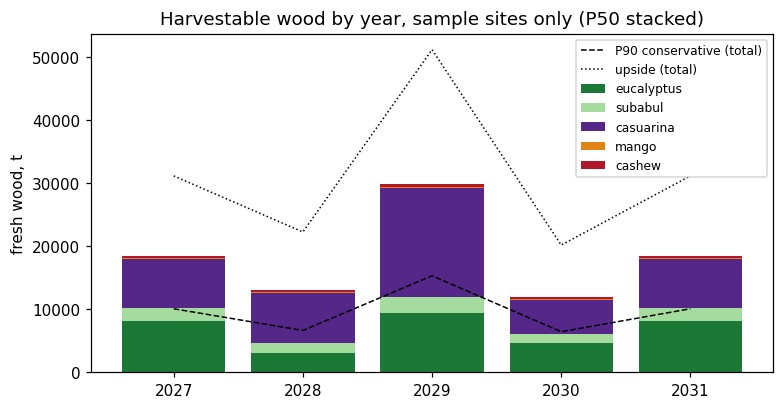
- Standing and harvestable wood, with a multi-year supply forecast (conservative / base / upside) on editable yield assumptions
- Area statistics by village, sub-district and district
- Accuracy report per project (per-class accuracy, area estimates with 95% confidence intervals), validated on field points
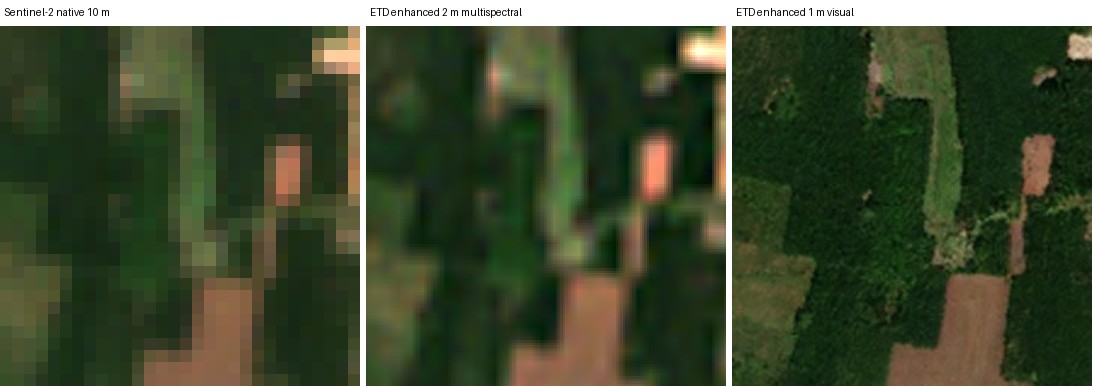
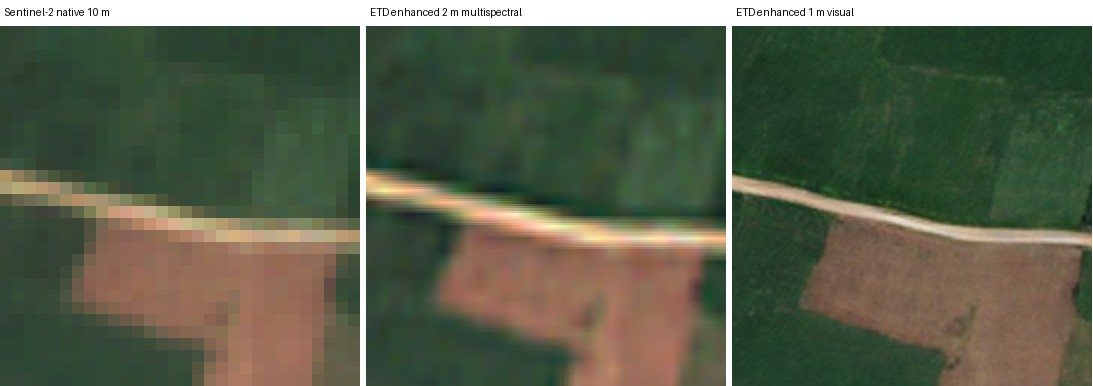
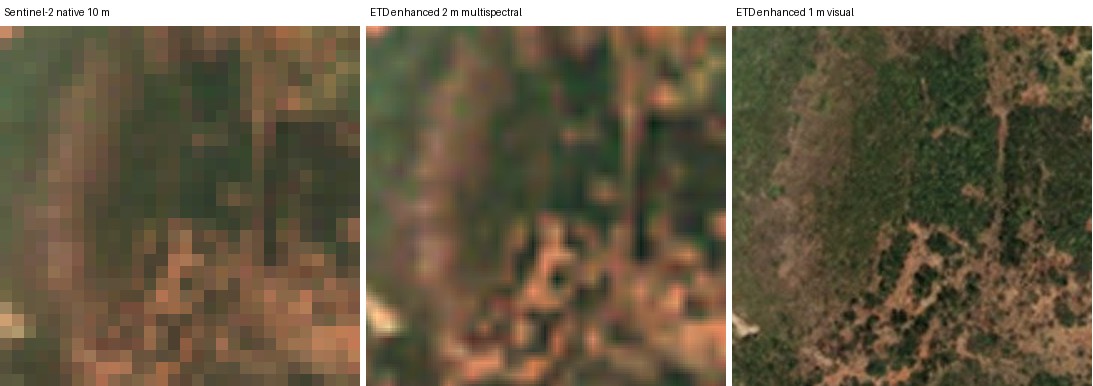
- Data: Sentinel-2 enhanced to 2m multispectral and 1m visual; Sentinel-1 radar at 2.5m through monsoon cloud; Landsat at 15m for orchard history before 2016. A 0.2 ha block is only about 20 native Sentinel-2 pixels
- For pulp, paper, board and biomass plants securing farm-wood supply; orchard and agri-finance; carbon and agroforestry programmes; governments tracking trees outside forests
- Deliverables: GIS block database (GeoPackage/GeoJSON/KML), species and planting-year maps (GeoTIFF, PDF), Excel area statistics, accuracy report, wood-supply workbook; optional web dashboard and annual refresh
- Pilot on 1–2 districts in about 10 weeks: scope and species list, mapping, field sample, wood model on your yield data, delivery; then scale-up and annual refresh